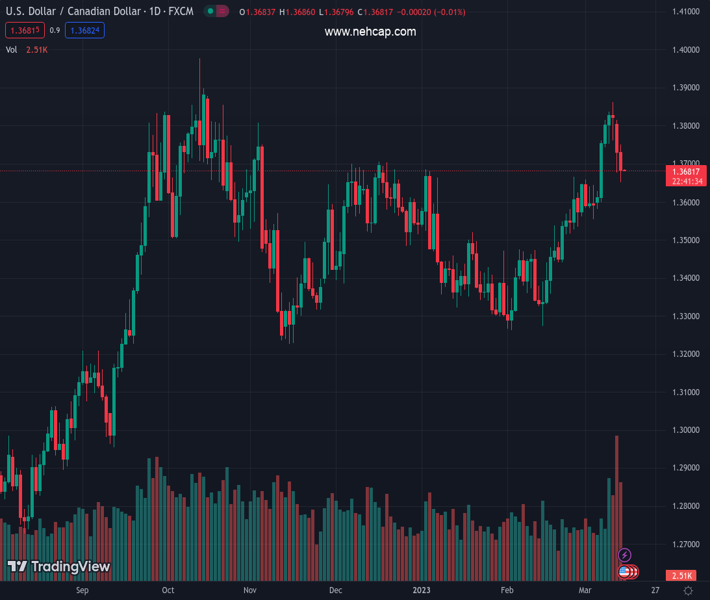
#USDCAD @ 1.36802 The Canadian Dollar held to gains bolstered by market sentiment and a soft US Dollar. (Pivot Orderbook analysis)
…
This is a premium post.
[s2If !current_user_can(access_s2member_level4)]Please register for PREMIUM VERSION HERE to read full post below containing analysis. In case of any error or you think you are not able to read the full post below, please email us at support#nehcap.com [lwa][/s2If] [s2If current_user_can(access_s2member_level4)]
- The Canadian Dollar held to gains bolstered by market sentiment and a soft US Dollar.
- US cooled on yearly figures, but core CPI rising MoM suggests inflation is stickier than estimates.
- The Federal Funds rates is expected to peak at around 5.0%, according to money market futures.
The pair currently trades last at 1.36802.
The previous day high was 1.3828 while the previous day low was 1.3677. The daily 38.2% Fib levels comes at 1.3735, expected to provide resistance. Similarly, the daily 61.8% fib level is at 1.377, expected to provide resistance.
USD/CAD drops on Tuesday by 0.37% after hitting a daily high of 1.3750 as Wall Street closes. A risk-on impulse weighed on the US Dollar (USD) and favored the Canadian Dollar (CAD), which despite falling oil prices, is clinging to gains. At the time of writing, the USD/CAD is trading at 1.3680.
Wall Street finished Tuesday’s session with 1% and 2.14% gains. Inflation in the United States (US), as reported by the Department of Labor (DoL), was lower than forecasts on annual figures. However, on a monthly basis, the Consumer Price Index (CPI) ticked down from 0.5% to 0.4%, but core CPI rose above estimates of 0.4% at 0.5%.
Recent turmoil in the US banking systems plunged US Treasury bond yields, particularly 2s, which fell 100 bps in two days. However, backstop measures implemented by the US Federal Reserve (Fed) have calmed investors, as shown by the market mood.
Given the backdrop, speculators have begun to price in a less aggressive Fed. The swaps market estimates the Fed would hike 25 basis points at the upcoming March meeting and is seeing rates peaking at the 4.75% – 5.00% range.
Consequently, US Treasury bond yields recovered some ground and underpinned the US Dollar. The US Dollar Index, a measure of the buck’s value vs. a basket of peers, finished the session with minuscule gains of 0.03%, at 103.659, and capped the USD/CAD rally.
Another reason that helped offset the Canadian dollar gains as oil prices collapsed by 4%, as shown by the US crude oil benchmark WTI. WTI finished the session losing 4.30% at $71.44 per barrel.
In later news, a crash between a Russian fighter jet and a US drone caused a dip in US equities, though most indices pared those losses and finished higher.
The lack of data in the Canadian docket kept investors leaning on the US Dollar dynamics, sentiment, and oil prices. On the US front, the economic calendar will feature the Retail Sales, the Producer Price Index, and the New York Empire State Manufacturing Index.
Technical Levels: Supports and Resistances
USDCAD currently trading at 1.3686 at the time of writing. Pair opened at 1.3731 and is trading with a change of -0.33 % .
| Overview | Overview.1 | |
|---|---|---|
| 0 | Today last price | 1.3686 |
| 1 | Today Daily Change | -0.0045 |
| 2 | Today Daily Change % | -0.3300 |
| 3 | Today daily open | 1.3731 |
The pair remains strongly bullish on the daily timeframe. It trades above its 20 SMA @ 1.3596, 50 SMA 1.3483, 100 SMA @ 1.3504 and 200 SMA @ 1.3319.
| Trends | Trends.1 | |
|---|---|---|
| 0 | Daily SMA20 | 1.3596 |
| 1 | Daily SMA50 | 1.3483 |
| 2 | Daily SMA100 | 1.3504 |
| 3 | Daily SMA200 | 1.3319 |
The previous day high was 1.3828 while the previous day low was 1.3677. The daily 38.2% Fib levels comes at 1.3735, expected to provide resistance. Similarly, the daily 61.8% fib level is at 1.377, expected to provide resistance.
Note the levels of interest below:
- Pivot support is noted at 1.3663, 1.3594, 1.3512
- Pivot resistance is noted at 1.3814, 1.3896, 1.3964
| Levels | Levels.1 |
|---|---|
| Previous Daily High | 1.3828 |
| Previous Daily Low | 1.3677 |
| Previous Weekly High | 1.3862 |
| Previous Weekly Low | 1.3582 |
| Previous Monthly High | 1.3666 |
| Previous Monthly Low | 1.3262 |
| Daily Fibonacci 38.2% | 1.3735 |
| Daily Fibonacci 61.8% | 1.3770 |
| Daily Pivot Point S1 | 1.3663 |
| Daily Pivot Point S2 | 1.3594 |
| Daily Pivot Point S3 | 1.3512 |
| Daily Pivot Point R1 | 1.3814 |
| Daily Pivot Point R2 | 1.3896 |
| Daily Pivot Point R3 | 1.3964 |
[/s2If]
Join Our Telegram Group
")


