The S&P 500, the Nasdaq 100, and the Dow Jones advanced as traders prepared for US Retail Sales. (Pivot Orderbook analysis)
…
This is a premium post.
[s2If !current_user_can(access_s2member_level4)]Please register for PREMIUM VERSION HERE to read full post below containing analysis. In case of any error or you think you are not able to read the full post below, please email us at support#nehcap.com [lwa][/s2If] [s2If current_user_can(access_s2member_level4)]
- The S&P 500, the Nasdaq 100, and the Dow Jones advanced as traders prepared for US Retail Sales.
- US inflation cooled on a yearly basis, but on a monthly basis, core CPI advances.
- Investors are expecting the Federal Funds Rate to peak around 5%.
The pair currently trades last at 3892.97.
The previous day high was 3933.25 while the previous day low was 3807.12. The daily 38.2% Fib levels comes at 3855.3, expected to provide support. Similarly, the daily 61.8% fib level is at 3885.07, expected to provide support.
Wall Street is trading with solid gains, recovering after Monday’s volatile session sponsored by the US regional bank crisis, threatening to spread to other banks. However, the measures to contain the collapse of Silicon Valley Bank (SVB) appeared to cushion risk assets fall.
At the time of typing, the S&P 500 is gaining 0.72, at 3,883.55. Following suit is the heavy-tech Nasdaq 100, up 1.20% at 11,322.69, while the Dow Jones raises 0.22%, at 31,891.57.
Despite the current bank crisis, the latest economic data from the United States (US) would likely keep the US Federal Reserve (Fed) in a tightening mode. US inflation in the US came pretty much aligned with estimates, though on a monthly basis, the core Consumer Price Index (CPI) for February aimed for 0.5%, above forecasts of 0.4%. Headline inflation, the CPI, was 0.4% MoM, aligned with estimates. Annually based inflation data, in general, and core, was below estimates, showing the effect of higher interest rates.
In the meantime, expectations for a 25 bps rate hike by the Federal Reserve (Fed) remained elevated. Nevertheless, developments around the latest banking crisis in the US could influence Fed officials’ decisions next Wednesday. The CME FedWatch Tool odds for a 25 bps hike lie at 65% to the 4.75% – 5.00% range.
Sector-wise, Communication Services, and Financials are the two leaders of the pack, up 2.13% and 1.76%. The laggards are Consumer Staples and Real Estate, each up 0.16% and 0.11%.
Of late, geopolitical concerns over a Russian aircraft crashing with a US drone exacerbated the newest dip in US equities.
US Treasury bond yields are recovering, led by 2s and 10s, each up 7% and 1.76%, respectively. The US Dollar Index (DXY) pairs some of its earlier gains and slides 0.04%, at 103.581.
The US economic calendar will feature February Producer Price Index (PPI) and Retail Sales. The New York Empire State Manufacturing Index for March and the NAHB Housing Market Index would also be revealed.
Technical Levels: Supports and Resistances
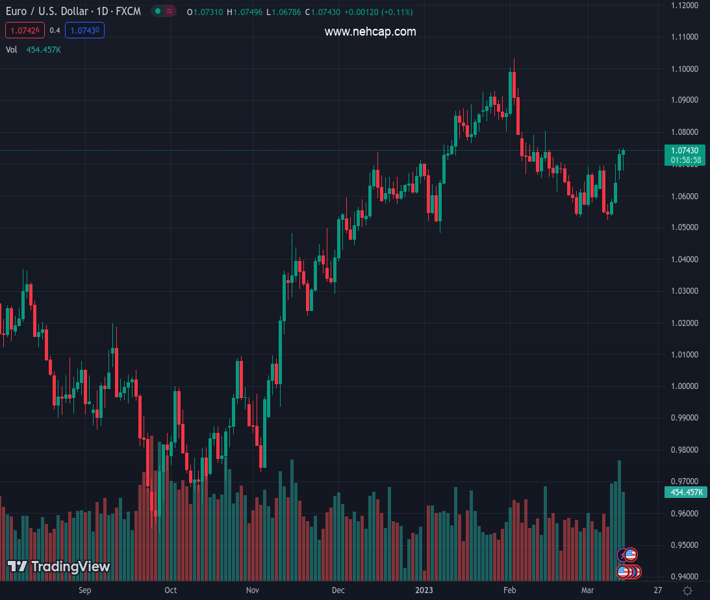
EURUSD currently trading at 3892.97 at the time of writing. Pair opened at 3861.91 and is trading with a change of 0.8 % .
| Overview | Overview.1 | |
|---|---|---|
| 0 | Today last price | 3892.97 |
| 1 | Today Daily Change | 31.06 |
| 2 | Today Daily Change % | 0.80 |
| 3 | Today daily open | 3861.91 |
The pair remains strongly bearish on the daily time frame. It trades below the 20 SMA @ 4003.28, 50 SMA 4007.18, 100 SMA @ 3957.39 and 200 SMA @ 3931.34.
| Trends | Trends.1 | |
|---|---|---|
| 0 | Daily SMA20 | 4003.28 |
| 1 | Daily SMA50 | 4007.18 |
| 2 | Daily SMA100 | 3957.39 |
| 3 | Daily SMA200 | 3931.34 |
The previous day high was 3933.25 while the previous day low was 3807.12. The daily 38.2% Fib levels comes at 3855.3, expected to provide support. Similarly, the daily 61.8% fib level is at 3885.07, expected to provide support.
Note the levels of interest below:
- Pivot support is noted at 3801.6, 3741.3, 3675.47
- Pivot resistance is noted at 3927.73, 3993.56, 4053.86
| Levels | Levels.1 |
|---|---|
| Previous Daily High | 3933.25 |
| Previous Daily Low | 3807.12 |
| Previous Weekly High | 4076.17 |
| Previous Weekly Low | 3843.78 |
| Previous Monthly High | 4192.63 |
| Previous Monthly Low | 3940.95 |
| Daily Fibonacci 38.2% | 3855.30 |
| Daily Fibonacci 61.8% | 3885.07 |
| Daily Pivot Point S1 | 3801.60 |
| Daily Pivot Point S2 | 3741.30 |
| Daily Pivot Point S3 | 3675.47 |
| Daily Pivot Point R1 | 3927.73 |
| Daily Pivot Point R2 | 3993.56 |
| Daily Pivot Point R3 | 4053.86 |
[/s2If]
Join Our Telegram Group
")


