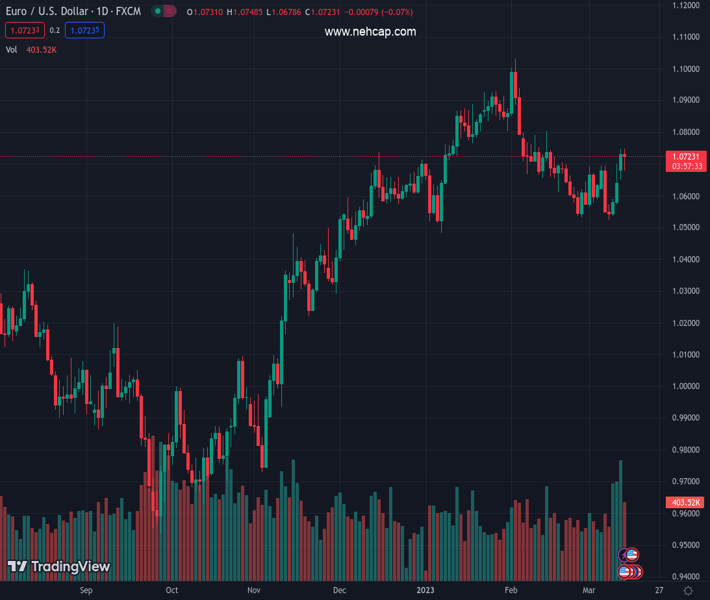
#EURUSD @ 1.07201 slips just below Tuesday’s open price of 1.0729 (Pivot Orderbook analysis)
…
This is a premium post.
[s2If !current_user_can(access_s2member_level4)]Please register for PREMIUM VERSION HERE to read full post below containing analysis. In case of any error or you think you are not able to read the full post below, please email us at support#nehcap.com [lwa][/s2If] [s2If current_user_can(access_s2member_level4)]
The pair currently trades last at 1.07201.
The previous day high was 1.0749 while the previous day low was 1.0642. The daily 38.2% Fib levels comes at 1.0708, expected to provide support. Similarly, the daily 61.8% fib level is at 1.0683, expected to provide support.
EUR/USD currency pair trades under pressure around 1.0717 at the press time after Tuesday’s US CPI data release. However, the losses remain limited as market participants assess the inflation data’s implications on the Fed’s monetary policy. As of writing, the EUR/USD is down 0.05% on the day, with the daily high and low at 1.0748 and 1.0679, respectively.
According to Société Générale economists, if ECB President Christine Lagarde delivers a hawkish press conference and raises rates by 50 bps on Thursday, the EUR/USD pair could climb above 1.0800.
It is essential to closely follow the US February Retail Sales report on Wednesday at 12:30 GMT and ECB Monetary Policy Decision Statement on Thursday at 13:15 GMT as they are critical data points in the short term.
Due to the devastating collapse of Silicon Valley Bank (SVB), the market is anticipating that the Federal Reserve (Fed) will adopt a less aggressive monetary policy stance.
This is because the Federal Reserve (Fed) may want to avoid hiking rates in the future to prevent more banking collapses from occurring.
From a technical perspective, the EUR/USD pair faces immediate resistance at 1.0772, followed by 1.0814 and 1.0879 levels. On the other hand, the support is at 1.0666, followed by 1.0601 and 1.0560 levels. The daily 20-SMA is 1.0634, while the daily 50-SMA is 1.0723. The daily RSI(14) is at 54.906 with a neutral stance. The 38.2% Fibonacci retracement level of the latest daily decline is at 1.0708, while the 61.8% Fibonacci level is at 1.0683.
Technical Levels: Supports and Resistances
EURUSD currently trading at 1.0715 at the time of writing. Pair opened at 1.0731 and is trading with a change of -0.15 % .
| Overview | Overview.1 | |
|---|---|---|
| 0 | Today last price | 1.0715 |
| 1 | Today Daily Change | -0.0016 |
| 2 | Today Daily Change % | -0.1500 |
| 3 | Today daily open | 1.0731 |
The pair is trading above its 20 Daily moving average @ 1.0634, below its 50 Daily moving average @ 1.0723 , above its 100 Daily moving average @ 1.0543 and above its 200 Daily moving average @ 1.0326
| Trends | Trends.1 | |
|---|---|---|
| 0 | Daily SMA20 | 1.0634 |
| 1 | Daily SMA50 | 1.0723 |
| 2 | Daily SMA100 | 1.0543 |
| 3 | Daily SMA200 | 1.0326 |
The previous day high was 1.0749 while the previous day low was 1.0642. The daily 38.2% Fib levels comes at 1.0708, expected to provide support. Similarly, the daily 61.8% fib level is at 1.0683, expected to provide support.
Note the levels of interest below:
- Pivot support is noted at 1.0666, 1.0601, 1.056
- Pivot resistance is noted at 1.0772, 1.0814, 1.0879
| Levels | Levels.1 |
|---|---|
| Previous Daily High | 1.0749 |
| Previous Daily Low | 1.0642 |
| Previous Weekly High | 1.0701 |
| Previous Weekly Low | 1.0524 |
| Previous Monthly High | 1.1033 |
| Previous Monthly Low | 1.0533 |
| Daily Fibonacci 38.2% | 1.0708 |
| Daily Fibonacci 61.8% | 1.0683 |
| Daily Pivot Point S1 | 1.0666 |
| Daily Pivot Point S2 | 1.0601 |
| Daily Pivot Point S3 | 1.0560 |
| Daily Pivot Point R1 | 1.0772 |
| Daily Pivot Point R2 | 1.0814 |
| Daily Pivot Point R3 | 1.0879 |
[/s2If]
Join Our Telegram Group
")


