#XAUUSD @ 1,909.45 US CPI numbers are mostly in line with expectations. (Pivot Orderbook analysis)
…
This is a premium post.
[s2If !current_user_can(access_s2member_level4)]Please register for PREMIUM VERSION HERE to read full post below containing analysis. In case of any error or you think you are not able to read the full post below, please email us at support#nehcap.com [lwa][/s2If] [s2If current_user_can(access_s2member_level4)]
- US CPI numbers are mostly in line with expectations.
- US Dollar resumes slide across the board, Wall Street futures hit fresh highs.
- XAU/USD holds above $1,900 after US data, looking at recent highs.
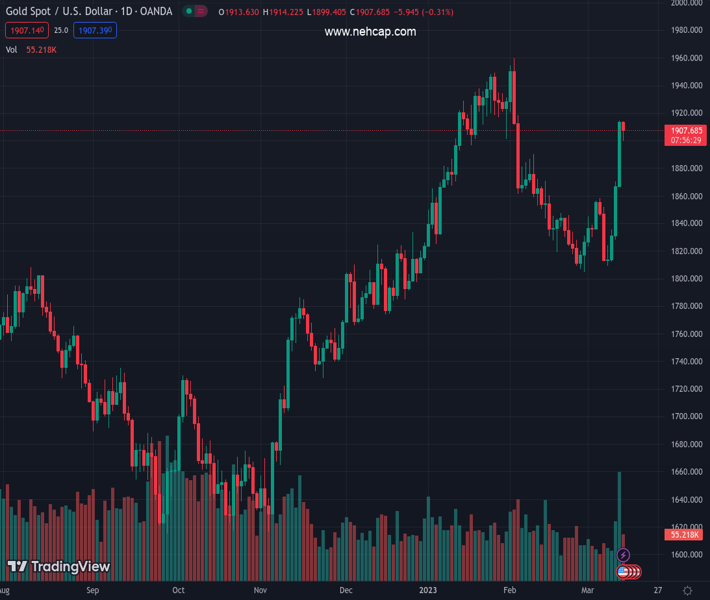
The pair currently trades last at 1909.45.
The previous day high was 1914.67 while the previous day low was 1867.66. The daily 38.2% Fib levels comes at 1896.71, expected to provide support. Similarly, the daily 61.8% fib level is at 1885.62, expected to provide support.
Gold prices moved to the upside following the release of US inflation data. XAU/USD climbed from near $1,900, reached levels above $1,910 and lost strength. The yellow metal is looking at the monthly high it reached earlier on Tuesday at $1,915.
The US Consumer Price Index (CPI) rose in February 0.4%, and the annual rate slowed down from 6.4% in January to 6.0%; both matched market consensus. The Core CPI rose 0.5% from the previous month, slightly above the 0.4% expected; and the annual Core rate rose 5.5% from the previous year, below the 5.6% of the previous month.
US Inflation numbers offered no surprise to market participants. US yield rose modestly, suggesting that the upside in Gold is being driven by a weaker US Dollar across the board and an improvement in sentiment. If the upside moves in US yields continue, XAU/USD could find difficulties extending gains.
XAU/USD is facing a strong resistance around $1,915 and a break higher would clear the way to more gains. The next area to watch stands at $1,935/40. On the contrary, the band $1,900-$1,895 emerges as the initial support followed by $1,875.
Technical Levels: Supports and Resistances
XAUUSD currently trading at 1906.41 at the time of writing. Pair opened at 1913.77 and is trading with a change of -0.38 % .
| Overview | Overview.1 | |
|---|---|---|
| 0 | Today last price | 1906.41 |
| 1 | Today Daily Change | -7.36 |
| 2 | Today Daily Change % | -0.38 |
| 3 | Today daily open | 1913.77 |
The pair remains strongly bullish on the daily timeframe. It trades above its 20 SMA @ 1838.45, 50 SMA 1872.87, 100 SMA @ 1813.1 and 200 SMA @ 1775.42.
| Trends | Trends.1 | |
|---|---|---|
| 0 | Daily SMA20 | 1838.45 |
| 1 | Daily SMA50 | 1872.87 |
| 2 | Daily SMA100 | 1813.10 |
| 3 | Daily SMA200 | 1775.42 |
The previous day high was 1914.67 while the previous day low was 1867.66. The daily 38.2% Fib levels comes at 1896.71, expected to provide support. Similarly, the daily 61.8% fib level is at 1885.62, expected to provide support.
Note the levels of interest below:
- Pivot support is noted at 1882.73, 1851.69, 1835.72
- Pivot resistance is noted at 1929.74, 1945.71, 1976.75
| Levels | Levels.1 |
|---|---|
| Previous Daily High | 1914.67 |
| Previous Daily Low | 1867.66 |
| Previous Weekly High | 1870.09 |
| Previous Weekly Low | 1809.46 |
| Previous Monthly High | 1959.80 |
| Previous Monthly Low | 1804.76 |
| Daily Fibonacci 38.2% | 1896.71 |
| Daily Fibonacci 61.8% | 1885.62 |
| Daily Pivot Point S1 | 1882.73 |
| Daily Pivot Point S2 | 1851.69 |
| Daily Pivot Point S3 | 1835.72 |
| Daily Pivot Point R1 | 1929.74 |
| Daily Pivot Point R2 | 1945.71 |
| Daily Pivot Point R3 | 1976.75 |
[/s2If]
Join Our Telegram Group
")


