#AUDUSD @ 0.66503 recovers early lost ground, albeit lacks follow-through or bullish conviction. (Pivot Orderbook analysis)
…
This is a premium post.
[s2If !current_user_can(access_s2member_level4)]Please register for PREMIUM VERSION HERE to read full post below containing analysis. In case of any error or you think you are not able to read the full post below, please email us at support#nehcap.com [lwa][/s2If] [s2If current_user_can(access_s2member_level4)]
- AUD/USD recovers early lost ground, albeit lacks follow-through or bullish conviction.
- A positive risk tone benefits the risk-sensitive Aussie, though a stronger USD caps gains.
- Traders also seem reluctant to place aggressive bets ahead of the crucial US CPI report.
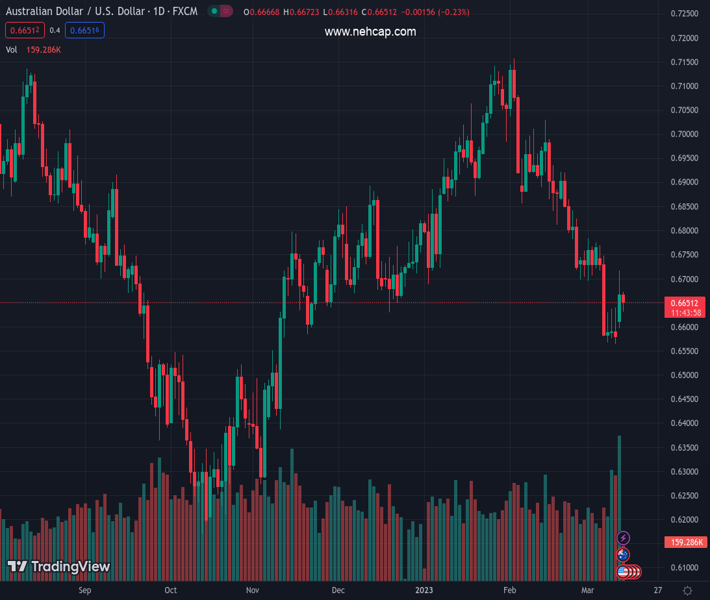
The pair currently trades last at 0.66503.
The previous day high was 0.6717 while the previous day low was 0.6579. The daily 38.2% Fib levels comes at 0.6664, expected to provide resistance. Similarly, the daily 61.8% fib level is at 0.6632, expected to provide support.
The AUD/USD pair attracts some dip-buying near the 0.6630 area on Tuesday and climbs to a fresh daily high during the early part of the European session. Spot prices, however, struggle to capitalize on the intraday move up beyond the 0.6670 region and remain below a multi-day top touched the previous day.
As the shock from the collapse of three US banks in a week began to recede, a modest recovery in the global equity markets turn out to be a key factor lending some support to the risk-sensitive Aussie. That said, a goodish pickup in the US Dollar demand, bolstered by rebounding US Treasury bond yields, keeps a lid on any meaningful upside for the AUD/USD pair, at least for the time being.
The uptick in the US bond yields comes after the US authorities moved to limit the fallout from the sudden collapse of Silicon Valley Bank (SVB). In fact, the Federal Reserve on Sunday announced that it will make available additional funding to eligible depository institutions to help assure banks have the ability to meet the needs of all their depositors and ease fears of a broader systemic crisis.
Apart from this, traders seem reluctant to place aggressive bets and prefer to wait on the sidelines ahead of the release of the key US consumer inflation figures, due later during the early North American session. Given the strain on the US banking system, the Fed is now expected to slow, if not halt, its interest rate-hiking cycle. Hence, a stronger US CPI print might do little to impress the USD bulls.
This, in turn, supports prospects for some near-term appreciating move for the AUD/USD pair. That said, the Reserve Bank of Australia’s (RBA) recent dovish shift, signalling that it might be nearing the end of its rate-hiking cycle, warrants some caution before confirming that spot prices have bottomed out in the near term.
Technical Levels: Supports and Resistances
AUDUSD currently trading at 0.6662 at the time of writing. Pair opened at 0.6667 and is trading with a change of -0.07 % .
| Overview | Overview.1 | |
|---|---|---|
| 0 | Today last price | 0.6662 |
| 1 | Today Daily Change | -0.0005 |
| 2 | Today Daily Change % | -0.0700 |
| 3 | Today daily open | 0.6667 |
The pair remains strongly bearish on the daily time frame. It trades below the 20 SMA @ 0.6762, 50 SMA 0.6882, 100 SMA @ 0.6768 and 200 SMA @ 0.6775.
| Trends | Trends.1 | |
|---|---|---|
| 0 | Daily SMA20 | 0.6762 |
| 1 | Daily SMA50 | 0.6882 |
| 2 | Daily SMA100 | 0.6768 |
| 3 | Daily SMA200 | 0.6775 |
The previous day high was 0.6717 while the previous day low was 0.6579. The daily 38.2% Fib levels comes at 0.6664, expected to provide resistance. Similarly, the daily 61.8% fib level is at 0.6632, expected to provide support.
Note the levels of interest below:
- Pivot support is noted at 0.6592, 0.6516, 0.6454
- Pivot resistance is noted at 0.673, 0.6792, 0.6868
| Levels | Levels.1 |
|---|---|
| Previous Daily High | 0.6717 |
| Previous Daily Low | 0.6579 |
| Previous Weekly High | 0.6770 |
| Previous Weekly Low | 0.6564 |
| Previous Monthly High | 0.7158 |
| Previous Monthly Low | 0.6698 |
| Daily Fibonacci 38.2% | 0.6664 |
| Daily Fibonacci 61.8% | 0.6632 |
| Daily Pivot Point S1 | 0.6592 |
| Daily Pivot Point S2 | 0.6516 |
| Daily Pivot Point S3 | 0.6454 |
| Daily Pivot Point R1 | 0.6730 |
| Daily Pivot Point R2 | 0.6792 |
| Daily Pivot Point R3 | 0.6868 |
[/s2If]
Join Our Telegram Group
")


