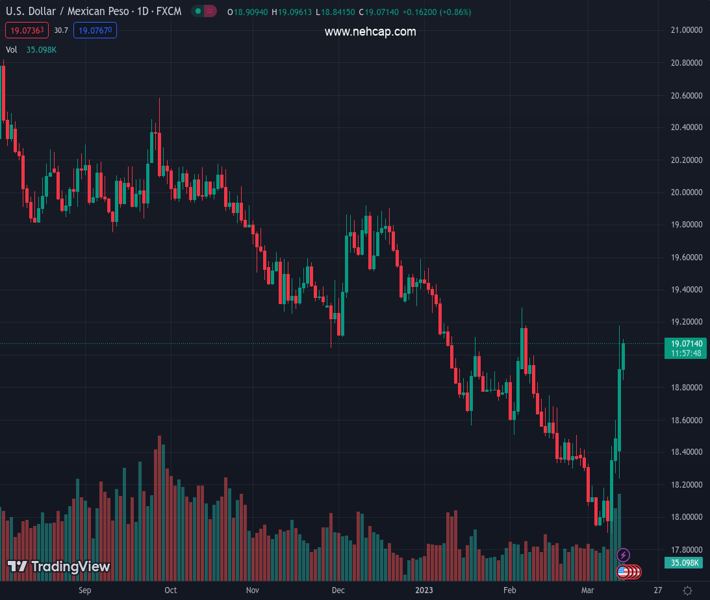
#USDMXN @ 19.0711 gains traction for the fourth straight day and trades near a one-month high set on Monday. (Pivot Orderbook analysis)
…
This is a premium post.
[s2If !current_user_can(access_s2member_level4)]Please register for PREMIUM VERSION HERE to read full post below containing analysis. In case of any error or you think you are not able to read the full post below, please email us at support#nehcap.com [lwa][/s2If] [s2If current_user_can(access_s2member_level4)]
- USD/MXN gains traction for the fourth straight day and trades near a one-month high set on Monday.
- Bulls now await a move beyond the 100-day SMA and 38.2% Fibo. confluence before placing fresh bets.
- Weakness back below the 18.35 horizontal support is needed to offset the near-term positive outlook.
The pair currently trades last at 19.0711.
The previous day high was 19.1812 while the previous day low was 18.2397. The daily 38.2% Fib levels comes at 18.8216, expected to provide support. Similarly, the daily 61.8% fib level is at 18.5994, expected to provide support.
The USD/MXN pair attracts some buying for the fourth successive day on Tuesday and maintains its bid tone through the early part of the European session. The pair steadily climbs back above the 19.00 mark and remains well within the striking distance of over a one-month top touched on Monday.
Given that oscillators on the daily chart are holding in the positive territory and are still far from being in the overbought zone, the technical setup favours bullish traders. That said, the overnight failures to find acceptance above the 100-day Simple Moving Average (SMA) and the 38.2% Fibonacci retracement level of the July 2022-March 2023 downfall warrant caution. This makes it prudent to wait for a convincing break through the said confluence barrier before positioning for any further appreciating move.
The USD/MXN pair could then aim to surpass the February monthly swing high, around the 19.30 region and climb to the 50% Fibo. level, around the mid-19.00s. The upward trajectory could get extended towards testing the 19.75-19.80 horizontal support breakpoint, which now coincides with the 61.8% Fibo. level and should act as a pivotal point. A convincing breakthrough will set the stage for an extension of the recent strong recovery move from sub-18.00 levels, or a multi-year low touched last week.
On the flip side, the 23.6% Fibo. level, around the 18.65 area, now seems to protect the immediate downside ahead of the 18.35 horizontal support. Sustained weakness below will suggest that a one-week-old uptrend has run out of steam and make the USD/MXN pair vulnerable to retesting the 18.00-17.90 support zone.
Technical Levels: Supports and Resistances
USDMXN currently trading at 19.0057 at the time of writing. Pair opened at 18.912 and is trading with a change of 0.5 % .
| Overview | Overview.1 | |
|---|---|---|
| 0 | Today last price | 19.0057 |
| 1 | Today Daily Change | 0.0937 |
| 2 | Today Daily Change % | 0.5000 |
| 3 | Today daily open | 18.9120 |
The pair is trading above its 20 Daily moving average @ 18.3351, above its 50 Daily moving average @ 18.6751 , below its 100 Daily moving average @ 19.113 and below its 200 Daily moving average @ 19.6429
| Trends | Trends.1 | |
|---|---|---|
| 0 | Daily SMA20 | 18.3351 |
| 1 | Daily SMA50 | 18.6751 |
| 2 | Daily SMA100 | 19.1130 |
| 3 | Daily SMA200 | 19.6429 |
The previous day high was 19.1812 while the previous day low was 18.2397. The daily 38.2% Fib levels comes at 18.8216, expected to provide support. Similarly, the daily 61.8% fib level is at 18.5994, expected to provide support.
Note the levels of interest below:
- Pivot support is noted at 18.3741, 17.8361, 17.4325
- Pivot resistance is noted at 19.3156, 19.7192, 20.2571
| Levels | Levels.1 |
|---|---|
| Previous Daily High | 19.1812 |
| Previous Daily Low | 18.2397 |
| Previous Weekly High | 18.5957 |
| Previous Weekly Low | 17.8977 |
| Previous Monthly High | 19.2901 |
| Previous Monthly Low | 18.2954 |
| Daily Fibonacci 38.2% | 18.8216 |
| Daily Fibonacci 61.8% | 18.5994 |
| Daily Pivot Point S1 | 18.3741 |
| Daily Pivot Point S2 | 17.8361 |
| Daily Pivot Point S3 | 17.4325 |
| Daily Pivot Point R1 | 19.3156 |
| Daily Pivot Point R2 | 19.7192 |
| Daily Pivot Point R3 | 20.2571 |
[/s2If]
Join Our Telegram Group
")


