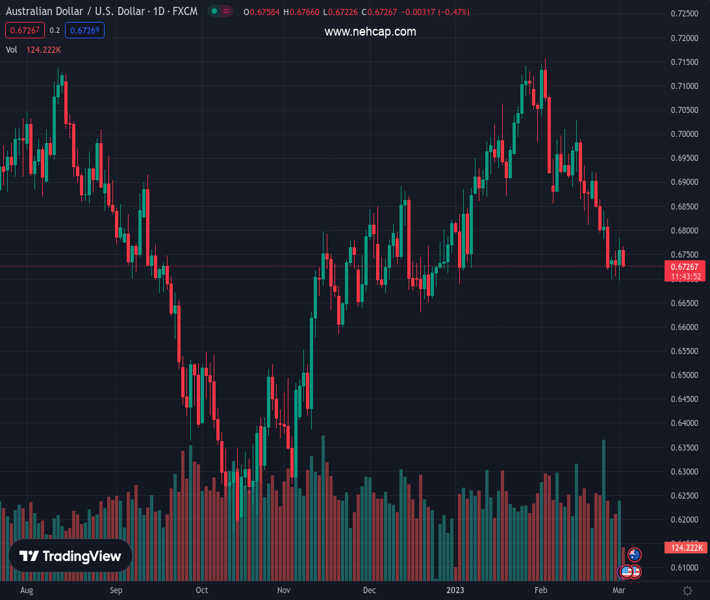
#AUDUSD @ 0.67245 meets with a fresh supply on Thursday amid the emergence of fresh USD buying. (Pivot Orderbook analysis)
…
This is a premium post.
[s2If !current_user_can(access_s2member_level4)]Please register for PREMIUM VERSION HERE to read full post below containing analysis. In case of any error or you think you are not able to read the full post below, please email us at support#nehcap.com [lwa][/s2If] [s2If current_user_can(access_s2member_level4)]
- AUD/USD meets with a fresh supply on Thursday amid the emergence of fresh USD buying.
- Hawkish Fed expectations continue to push the US bond yields higher and underpin the buck.
- Looming recession risks further contribute to driving flow away from the risk-sensitive Aussie.
The pair currently trades last at 0.67245.
The previous day high was 0.6784 while the previous day low was 0.6695. The daily 38.2% Fib levels comes at 0.675, expected to provide resistance. Similarly, the daily 61.8% fib level is at 0.6729, expected to provide resistance.
The AUD/USD pair comes under some renewed selling pressure on Thursday and maintains its offered tone through the first half of the European session. The pair is currently placed around the 0.6725-0.6720 region and remains well within the striking distance of its lowest level since early January touched the previous day.
The US Dollar regains positive traction and reverses a part of the previous day’s sharp retracement slide from a multi-week top, which, in turn, is seen as a key factor weighing on the AUD/USD pair. Growing acceptance that the Fed will stick to its hawkish stance for longer continues to push the US Treasury bond yields higher. Apart from this, the prevalent cautious market mood – amid looming recession risks – further benefits the safe-haven Greenback and contributes to driving flows away from the risk-sensitive Aussie.
The markets seem convinced that the US central bank will continue to tighten its monetary policy in the wake of stubbornly high inflation. Moreover, the incoming US macro data pointed to an economy that remains resilient despite rising borrowing costs and should allow the Fed to keep interest rates higher. Adding to this, Minneapolis Fed President Neel Kashkari opened the door for a 50 bps hike at the next meeting in May and lifts the yield on the benchmark 10-year US government bond to its highest level since November.
Meanwhile, the overnight optimism led by the upbeat Chinese PMI prints for February fades rather quickly amid looming recession risk. This is evident from a generally softer tone around the equity markets, which lends additional support to the USD and suggests that the path of least resistance for the AUD/USD pair is to the downside. That said, it will still be prudent to wait for sustained weakness below the 0.6700 mark before placing fresh bearish bets and positioning for a further near-term depreciating move.
Market participants now look forward to the release of the Weekly Initial Jobless Claims data from the US, due later during the early North American session. This, along with the US bond yields and the broader risk sentiment, should influence the USD price dynamics and provide some impetus to the AUD/USD pair.
Technical Levels: Supports and Resistances
AUDUSD currently trading at 0.6736 at the time of writing. Pair opened at 0.6754 and is trading with a change of -0.27 % .
| Overview | Overview.1 | |
|---|---|---|
| 0 | Today last price | 0.6736 |
| 1 | Today Daily Change | -0.0018 |
| 2 | Today Daily Change % | -0.2700 |
| 3 | Today daily open | 0.6754 |
The pair remains strongly bearish on the daily time frame. It trades below the 20 SMA @ 0.6879, 50 SMA 0.6896, 100 SMA @ 0.6739 and 200 SMA @ 0.6796.
| Trends | Trends.1 | |
|---|---|---|
| 0 | Daily SMA20 | 0.6879 |
| 1 | Daily SMA50 | 0.6896 |
| 2 | Daily SMA100 | 0.6739 |
| 3 | Daily SMA200 | 0.6796 |
The previous day high was 0.6784 while the previous day low was 0.6695. The daily 38.2% Fib levels comes at 0.675, expected to provide resistance. Similarly, the daily 61.8% fib level is at 0.6729, expected to provide resistance.
Note the levels of interest below:
- Pivot support is noted at 0.6705, 0.6656, 0.6617
- Pivot resistance is noted at 0.6794, 0.6833, 0.6882
| Levels | Levels.1 |
|---|---|
| Previous Daily High | 0.6784 |
| Previous Daily Low | 0.6695 |
| Previous Weekly High | 0.6921 |
| Previous Weekly Low | 0.6719 |
| Previous Monthly High | 0.7158 |
| Previous Monthly Low | 0.6698 |
| Daily Fibonacci 38.2% | 0.6750 |
| Daily Fibonacci 61.8% | 0.6729 |
| Daily Pivot Point S1 | 0.6705 |
| Daily Pivot Point S2 | 0.6656 |
| Daily Pivot Point S3 | 0.6617 |
| Daily Pivot Point R1 | 0.6794 |
| Daily Pivot Point R2 | 0.6833 |
| Daily Pivot Point R3 | 0.6882 |
[/s2If]
Join Our Telegram Group
")


