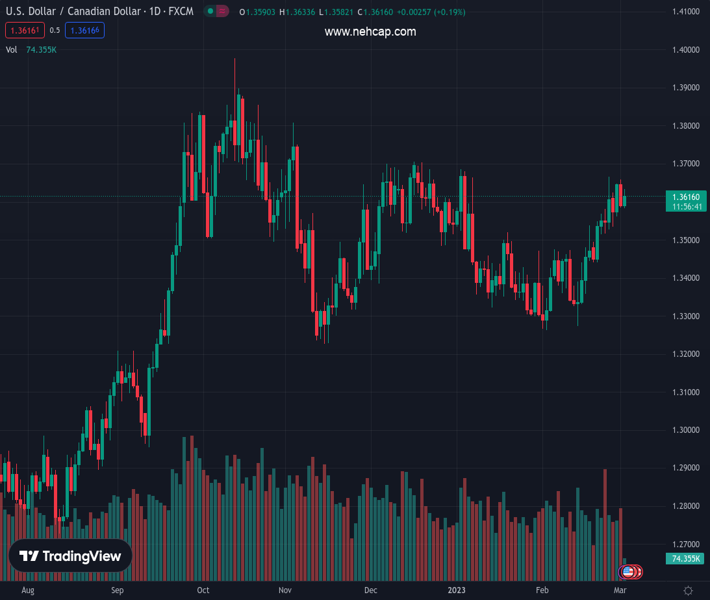
#USDCAD @ 1.36152 gains some positive traction on Thursday, albeit lacks strong follow-through buying. (Pivot Orderbook analysis)
…
This is a premium post.
[s2If !current_user_can(access_s2member_level4)]Please register for PREMIUM VERSION HERE to read full post below containing analysis. In case of any error or you think you are not able to read the full post below, please email us at support#nehcap.com [lwa][/s2If] [s2If current_user_can(access_s2member_level4)]
- USD/CAD gains some positive traction on Thursday, albeit lacks strong follow-through buying.
- An uptick in Crude Oil prices underpins the Loonie and keeps a lid on the intraday positive move.
- Hawkish Fed expectations, rising US bond yields boost the USD and continue to act as a tailwind.
The pair currently trades last at 1.36152.
The previous day high was 1.3659 while the previous day low was 1.3584. The daily 38.2% Fib levels comes at 1.3613, expected to provide support. Similarly, the daily 61.8% fib level is at 1.3631, expected to provide resistance.
The USD/CAD pair struggles to capitalize on its intraday positive move on Thursday and retreats to the 1.3600 round-figure mark during the first half of the European session.
Crude Oil prices reverse a modest dip and touch a nearly two-week high in the last hour, which, in turn, is seen underpinning the commodity-linked Loonie and acting as a headwind for the USD/CAD pair. The uptick in Oil prices, however, lacks bullish conviction amid worries that rapidly rising borrowing costs will dampen economic growth and dent fuel demand. Apart from this, resurgent US Dollar demand, bolstered by hawkish Fed expectations, supports prospects for some meaningful upside for the major.
The markets now seem convinced that the US central bank will keep interest rates higher for longer than expected in the wake of stubbornly high inflation. Furthermore, Minneapolis Fed President Neel Kashkari opened the door for a 50 bps hike at the next meeting in March, which continues to push the US Treasury bond yields higher. In fact, the yield on the benchmark 10-year US government bond climbs to its highest level since November, further beyond the 4.0% threshold, and acts as a tailwind for the Greenback.
Furthermore, the prevalent cautious market mood – amid looming recession risks – further benefits the safe-haven buck. Apart from this, speculations that the Bank of Canada (BoC) could pause the policy-tightening cycle, bolstered by a softer Canadian CPI report released last week, favours the USD/CAD bulls. This, in turn, suggests that the path of least resistance for spot prices is to the upside.
Market participants now look forward to the release of the US Weekly Initial Jobless Claims data, due later during the early North American session. This, along with the US bond yields and the broader risk sentiment, will drive the USD demand and provide some impetus to the USD/CAD pair. Traders will further take cues from Oil price dynamics to grab short-term opportunities
Technical Levels: Supports and Resistances
USDCAD currently trading at 1.3602 at the time of writing. Pair opened at 1.3597 and is trading with a change of 0.04 % .
| Overview | Overview.1 | |
|---|---|---|
| 0 | Today last price | 1.3602 |
| 1 | Today Daily Change | 0.0005 |
| 2 | Today Daily Change % | 0.0400 |
| 3 | Today daily open | 1.3597 |
The pair remains strongly bullish on the daily timeframe. It trades above its 20 SMA @ 1.3466, 50 SMA 1.346, 100 SMA @ 1.3506 and 200 SMA @ 1.3276.
| Trends | Trends.1 | |
|---|---|---|
| 0 | Daily SMA20 | 1.3466 |
| 1 | Daily SMA50 | 1.3460 |
| 2 | Daily SMA100 | 1.3506 |
| 3 | Daily SMA200 | 1.3276 |
The previous day high was 1.3659 while the previous day low was 1.3584. The daily 38.2% Fib levels comes at 1.3613, expected to provide support. Similarly, the daily 61.8% fib level is at 1.3631, expected to provide resistance.
Note the levels of interest below:
- Pivot support is noted at 1.3568, 1.3539, 1.3493
- Pivot resistance is noted at 1.3643, 1.3688, 1.3717
| Levels | Levels.1 |
|---|---|
| Previous Daily High | 1.3659 |
| Previous Daily Low | 1.3584 |
| Previous Weekly High | 1.3666 |
| Previous Weekly Low | 1.3441 |
| Previous Monthly High | 1.3666 |
| Previous Monthly Low | 1.3262 |
| Daily Fibonacci 38.2% | 1.3613 |
| Daily Fibonacci 61.8% | 1.3631 |
| Daily Pivot Point S1 | 1.3568 |
| Daily Pivot Point S2 | 1.3539 |
| Daily Pivot Point S3 | 1.3493 |
| Daily Pivot Point R1 | 1.3643 |
| Daily Pivot Point R2 | 1.3688 |
| Daily Pivot Point R3 | 1.3717 |
[/s2If]
Join Our Telegram Group
")


