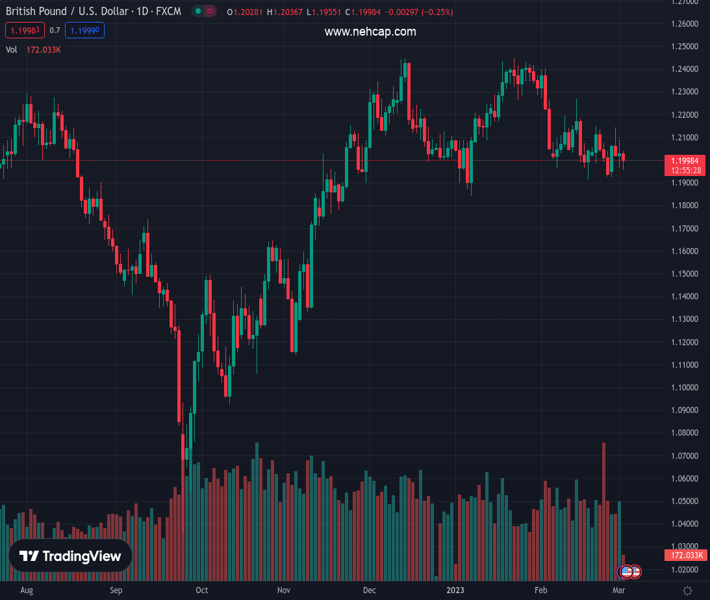
#GBPUSD @ 1.19917 meets with a fresh supply on Thursday amid a strong pickup in the USD demand. (Pivot Orderbook analysis)
…
This is a premium post.
[s2If !current_user_can(access_s2member_level4)]Please register for PREMIUM VERSION HERE to read full post below containing analysis. In case of any error or you think you are not able to read the full post below, please email us at support#nehcap.com [lwa][/s2If] [s2If current_user_can(access_s2member_level4)]
- GBP/USD meets with a fresh supply on Thursday amid a strong pickup in the USD demand.
- Hawkish Fed expectations continue to push the US bond yields higher and underpin the USD.
- A sustained break below the 200-day SMA is needed to support prospects for deeper losses.
The pair currently trades last at 1.19917.
The previous day high was 1.209 while the previous day low was 1.1965. The daily 38.2% Fib levels comes at 1.2013, expected to provide resistance. Similarly, the daily 61.8% fib level is at 1.2042, expected to provide resistance.
The GBP/USD pair comes under some fresh selling pressure following the previous day’s good two-way price swings and drifts lower through the first half of the European session. The downward trajectory drags spot prices back closer to mid-1.1900s in the last hour and well within the striking distance of a technically significant 200-day Simple Moving Average (SMA).
A combination of factors assists the US Dollar to regain strong positive traction, which, in turn, is seen exerting some downward pressure on the GBP/USD pair. The prospects for further policy tightening by the Fed continue to push the US Treasury bond yields higher. Apart from this, a softer risk tone – amid looming recession risks – lends additional support to the safe-haven Greenback.
Investors seem convinced that the Fed will stick to its hawkish stance in the wake of stubbornly high inflation. Furthermore, the incoming US macro data pointed to an economy that remains resilient despite rising borrowing costs and should allow the Fed to keep rates higher for longer. Moreover, FOMC policymaker Neel Kashkari opened the door for a 50 bps hike at the next meeting in March.
Kashkari noted that the risk of under-tightening is greater than the risk of over-tightening as inflation in the US is still very high. Separately, Atlanta Fed President Raphael Bostic maintained the view the policy rate needs to rise to the 5.00%-5.25% range and remain at that level well into 2024. This, in turn, remains supportive of elevated US bond yields and continues to underpin the Greenback.
In fact, the yield on the benchmark 10-year US government bond climbs further beyond the 4.0% threshold, to its highest level since November 2022, further fueling worries about economic headwinds stemming from rising borrowing costs. Apart from this, anxiety over the new UK-UK Brexit deal on the Northern Ireland Protocol weighs on the British Pound and drags the GBP/USD pair lower.
The price action, meanwhile, indicates that additional rate hike by the Bank of England (BoE) is already fully priced in the markets. Moreover, some analysts still hope that the UK central bank would pause the current tightening cycle, suggesting that the path of least resistance for the GBP/USD pair is to the downside. Spot prices, however, might still find some support near the 200-day SMA.
Nevertheless, the fundamental backdrop now seems tilted firmly in favour of bearish traders. Hence, any attempted recovery could be seen as a selling opportunity and runs the risk of fizzling out rather quickly. Traders now look to the release of the usual US Weekly Initial Jobless Claims, which, along with the US bond yields, will drive the USD and provide some impetus to the GBP/USD pair.
Technical Levels: Supports and Resistances
GBPUSD currently trading at 1.1965 at the time of writing. Pair opened at 1.2019 and is trading with a change of -0.45 % .
| Overview | Overview.1 | |
|---|---|---|
| 0 | Today last price | 1.1965 |
| 1 | Today Daily Change | -0.0054 |
| 2 | Today Daily Change % | -0.4500 |
| 3 | Today daily open | 1.2019 |
The pair is trading below its 20 Daily moving average @ 1.2062, below its 50 Daily moving average @ 1.2143 , below its 100 Daily moving average @ 1.197 and above its 200 Daily moving average @ 1.1923
| Trends | Trends.1 | |
|---|---|---|
| 0 | Daily SMA20 | 1.2062 |
| 1 | Daily SMA50 | 1.2143 |
| 2 | Daily SMA100 | 1.1970 |
| 3 | Daily SMA200 | 1.1923 |
The previous day high was 1.209 while the previous day low was 1.1965. The daily 38.2% Fib levels comes at 1.2013, expected to provide resistance. Similarly, the daily 61.8% fib level is at 1.2042, expected to provide resistance.
Note the levels of interest below:
- Pivot support is noted at 1.1959, 1.19, 1.1835
- Pivot resistance is noted at 1.2084, 1.2149, 1.2208
| Levels | Levels.1 |
|---|---|
| Previous Daily High | 1.2090 |
| Previous Daily Low | 1.1965 |
| Previous Weekly High | 1.2148 |
| Previous Weekly Low | 1.1928 |
| Previous Monthly High | 1.2402 |
| Previous Monthly Low | 1.1915 |
| Daily Fibonacci 38.2% | 1.2013 |
| Daily Fibonacci 61.8% | 1.2042 |
| Daily Pivot Point S1 | 1.1959 |
| Daily Pivot Point S2 | 1.1900 |
| Daily Pivot Point S3 | 1.1835 |
| Daily Pivot Point R1 | 1.2084 |
| Daily Pivot Point R2 | 1.2149 |
| Daily Pivot Point R3 | 1.2208 |
[/s2If]
Join Our Telegram Group
")


