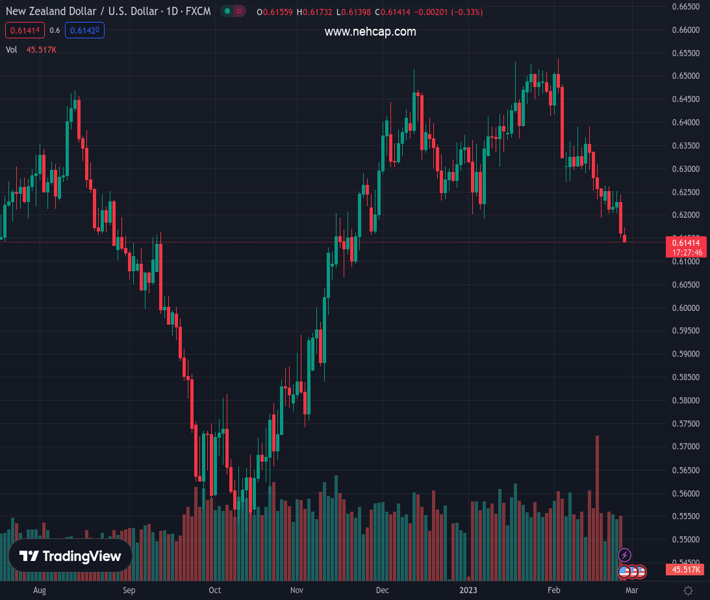
#NZDUSD @ 0.61412 has printed a fresh three-month low at 0.6150 amid the risk-off market mood. (Pivot Orderbook analysis)
…
This is a premium post.
[s2If !current_user_can(access_s2member_level4)]Please register for PREMIUM VERSION HERE to read full post below containing analysis. In case of any error or you think you are not able to read the full post below, please email us at support#nehcap.com [lwa][/s2If] [s2If current_user_can(access_s2member_level4)]
- NZD/USD has printed a fresh three-month low at 0.6150 amid the risk-off market mood.
- Federal Reserve looks set to push interest rates above 5% to contain sticky inflation.
- Reserve Bank of New Zealand Conway sees the terminal rate at 5.50% as higher interest rates are still required to cool the economy.
- NZD/USD has delivered a breakdown of the Inverted Flag pattern and is now prone to more downside.
The pair currently trades last at 0.61412.
The previous day high was 0.6252 while the previous day low was 0.6151. The daily 38.2% Fib levels comes at 0.619, expected to provide resistance. Similarly, the daily 61.8% fib level is at 0.6214, expected to provide resistance.
NZD/USD has refreshed its three-month low below 0.6148 in the Asian session. The kiwi asset has been dumped by the market participants amid weak New Zealand Retail Sales data and rising stakes for the continuation of policy tightening by the Federal Reserve (Fed).
The US Dollar Index (DXY) has revived firmly after a subdued opening and has reached to near 104.90 as the risk-off impulse is strengthening further. S&P500 futures have shown some recovery on Monday morning after reporting significant losses last week, portraying a caution in the overall risk-aversion theme. The odds of more rates announcement by the Federal Reserve to contain persistent inflation has soared the recession fears, which has had a devastating impact on the US equities.
More support for further policy restriction by the Federal Reserve has weakened the demand for US government bonds. A drop in the bonds demand has pushed the 10-year US Treasury yields above 3.94%.
The New Zealand Dollar has failed to find strength despite the dovish People’s Bank of China’s (PBoC) report. The report claims a rebound in the Chinese economy in 2023 as epidemic prevention has relaxed and consumption has improved. The vision of the PBoC is not limited to the expansion of domestic demand but is widened to longer-term economic growth and price stability.
It is worth noting that New Zealand is one of the leading trading partners of China and an expansionary monetary policy from the PBoC will strengthen the New Zealand Dollar.
January’s consumer spending data of the United States have cleared that a consideration of a policy tightening pause by the Federal Reserve would be premature. After a declining trend, the US Personal Consumption Expenditure (PCE) price index data has revived by 0.6% on a monthly basis. The rationale behind the households’ spending revival should be the higher wages offered by talent acquisition agencies in times when the US labor market is extremely tight.
Cleveland Federal Reserve Bank President Loretta Mester cited “Will need to go above 5% funds rate, stay there for a while.” He further added, “Data shows inflation not yet on trend to get back sustainably to 2% target.”
Considering the resilience in the United States economy, economists at Nordea see the Federal Reserve’s benchmark approaching 6%.
The Reserve Bank of New Zealand (RBNZ) is struggling to bring down price pressures led by higher prices of fuel and food items. The annual inflation rate in the New Zealand economy has not peaked yet and NZ Prime Minister Chris Hipkins has announced a mega-cyclone relief package, which is subjected to add to the escalating price index.
Reserve Bank of New Zealand Governor Adrian Orr must have found some relief as the Retail Sales data has contracted firmly. The Retail Sales data for the fourth quarter of CY2022 has contracted by 0.6% while the street was expecting an expansion of 1.5%. It looks like a drop in the confidence of households due to escalating Consumer Price Index (CPI).
Meanwhile, Reserve Bank of New Zealand Chief Economist Paul Conway delivered guidance for the Official Cash Rate (PCR) peak. Reserve Bank of New Zealand policymaker sees the terminal rate at 5.50% by mid-2023. He further added, “Higher interest rates are still required to cool the economy.”
NZD/USD has delivered a breakdown of the Inverted Flag chart pattern formed on an hourly scale. A breakdown of the inventory distribution part of the Inverted Flag chart pattern indicates that the transfer of inventory from the institutional investors to the retail participants is over.
The 20-period Exponential Moving Average (EMA) at 0.6173 is barricading the New Zealand Dollar.
Meanwhile, Relative Strength Index (RSI) (14) is oscillating in the bearish range of 20.00-40.00, indicating a continuation of downside momentum.
Technical Levels: Supports and Resistances
NZDUSD currently trading at 0.6146 at the time of writing. Pair opened at 0.6165 and is trading with a change of -0.31 % .
| Overview | Overview.1 | |
|---|---|---|
| 0 | Today last price | 0.6146 |
| 1 | Today Daily Change | -0.0019 |
| 2 | Today Daily Change % | -0.3100 |
| 3 | Today daily open | 0.6165 |
The pair remains strongly bearish on the daily time frame. It trades below the 20 SMA @ 0.6318, 50 SMA 0.6348, 100 SMA @ 0.6186 and 200 SMA @ 0.6184.
| Trends | Trends.1 | |
|---|---|---|
| 0 | Daily SMA20 | 0.6318 |
| 1 | Daily SMA50 | 0.6348 |
| 2 | Daily SMA100 | 0.6186 |
| 3 | Daily SMA200 | 0.6184 |
The previous day high was 0.6252 while the previous day low was 0.6151. The daily 38.2% Fib levels comes at 0.619, expected to provide resistance. Similarly, the daily 61.8% fib level is at 0.6214, expected to provide resistance.
Note the levels of interest below:
- Pivot support is noted at 0.6127, 0.6089, 0.6026
- Pivot resistance is noted at 0.6227, 0.629, 0.6328
| Levels | Levels.1 |
|---|---|
| Previous Daily High | 0.6252 |
| Previous Daily Low | 0.6151 |
| Previous Weekly High | 0.6263 |
| Previous Weekly Low | 0.6151 |
| Previous Monthly High | 0.6531 |
| Previous Monthly Low | 0.6190 |
| Daily Fibonacci 38.2% | 0.6190 |
| Daily Fibonacci 61.8% | 0.6214 |
| Daily Pivot Point S1 | 0.6127 |
| Daily Pivot Point S2 | 0.6089 |
| Daily Pivot Point S3 | 0.6026 |
| Daily Pivot Point R1 | 0.6227 |
| Daily Pivot Point R2 | 0.6290 |
| Daily Pivot Point R3 | 0.6328 |
[/s2If]
Join Our Telegram Group
")


