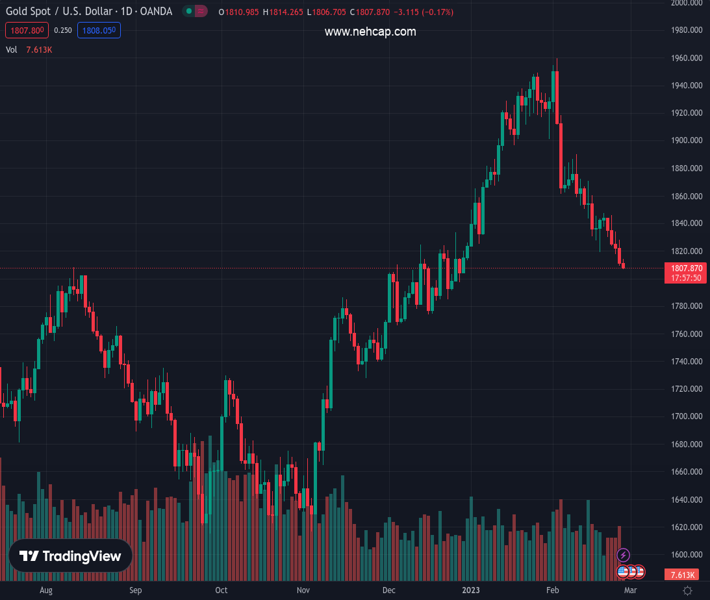
#XAUUSD @ 1,807.73 Gold price takes offers to renew intraday low, fades late Friday’s corrective bounce off two-month low., @nehcap view: Limited downside expected (Pivot Orderbook analysis)
…
This is a premium post.
[s2If !current_user_can(access_s2member_level4)]Please register for PREMIUM VERSION HERE to read full post below containing analysis. In case of any error or you think you are not able to read the full post below, please email us at support#nehcap.com [lwa][/s2If] [s2If current_user_can(access_s2member_level4)]
- Gold price takes offers to renew intraday low, fades late Friday’s corrective bounce off two-month low.
- Lack of major data/events challenges market moves but hawkish central banks, recession woes keep XAU/USD bears hopeful.
- US Durable Goods Orders, ISM PMIs will be crucial for near-term directions.
The pair currently trades last at 1807.73.
The previous day high was 1827.87 while the previous day low was 1808.99. The daily 38.2% Fib levels comes at 1816.2, expected to provide resistance. Similarly, the daily 61.8% fib level is at 1820.66, expected to provide resistance.
Gold price (XAU/USD) takes offers to refresh a two-month low to around $1,808 during early Monday. In doing so, the bright metal seems to justify the latest pick-up in the US Dollar, after a week-start retreat, amid the hawkish concerns surrounding the US Federal Reserve (Fed) and the geopolitical fears.
That said, the US Dollar Index (DXY) renews its intraday high around 105.30 following the initial pullback from a seven-week high. In doing so, the greenback’s gauge versus the six major currencies remains firmer for the fifth consecutive day.
The DXY’s rebound from the intraday low could be traced to the firmer US Treasury bond yields as the US 10-year Treasury yields reverse the early-day losses of around 3.95%. Further, the two-year counterparts jump back towards the highest levels since November 2022, marked the previous day, as bond bears poke the 4.83% level by the press time.
Fears of Aussie recession and slower consumption in New Zealand, as well as fears of a soft landing in the US, seem to have underpinned the XAU/USD’s recent weakness. Adding strength to the precious metal’s downturn could be the hawkish Fed concerns, especially after the last week’s strong inflation clues and upbeat comments from the policymakers. It should be noted that the latest chatters surrounding more Western sanctions on Russia and the Beijing-Moscow ties seem to also favor the Gold bears.
It’s worth noting, however, that the S&P 500 Futures lick its wounds with mild gains after the Wall Street benchmark posted the biggest weekly slump of 2023.
Looking forward, the Gold price remains on the bear’s radar amid a firmer US dollar and geopolitical concerns. However, an absence of top-tier data might allow the XAU/USD to pare some losses. That said, the week’s US ISM Manufacturing PMI, Services PMI, Durable Goods Orders and China’s official PMIs will be crucial for the traders to watch for clear directions.
Although the oversold RSI (14) challenges Gold sellers around $1,810, the metal’s sustained trading within the three-week-old descending trend channel and bearish MACD signals keep the XAU/USD bears hopeful.
That said, a convergence of the 100-DMA and the stated channel’s lower line, close to $1,793, appears short-term key support to watch for the Gold bears.
Following that, the 200-DMA level surrounding $1,775 could act as the last defense of the Gold buyers.
Alternatively, XAU/USD recovery remains elusive unless the bullion stays inside the aforementioned channel, currently between $1,793 and $1,832.
Even if the Gold price remains firmer past $1,832, the February 09 swing high of around $1,890 and the $1,900 threshold could challenge the buyer afterward.
Overall, the Gold price remains on the bear’s radar but the downside room appears limited.
Trend: Limited downside expected
Technical Levels: Supports and Resistances
XAUUSD currently trading at 1809.3 at the time of writing. Pair opened at 1810.94 and is trading with a change of -0.09% % .
| Overview | Overview.1 | |
|---|---|---|
| 0 | Today last price | 1809.3 |
| 1 | Today Daily Change | -1.64 |
| 2 | Today Daily Change % | -0.09% |
| 3 | Today daily open | 1810.94 |
The pair is trading below its 20 Daily moving average @ 1864.16, below its 50 Daily moving average @ 1865.35 , above its 100 Daily moving average @ 1792.35 and above its 200 Daily moving average @ 1776.01
| Trends | Trends.1 | |
|---|---|---|
| 0 | Daily SMA20 | 1864.16 |
| 1 | Daily SMA50 | 1865.35 |
| 2 | Daily SMA100 | 1792.35 |
| 3 | Daily SMA200 | 1776.01 |
The previous day high was 1827.87 while the previous day low was 1808.99. The daily 38.2% Fib levels comes at 1816.2, expected to provide resistance. Similarly, the daily 61.8% fib level is at 1820.66, expected to provide resistance.
Note the levels of interest below:
- Pivot support is noted at 1804.0, 1797.05, 1785.12
- Pivot resistance is noted at 1822.88, 1834.81, 1841.76
| Levels | Levels.1 |
|---|---|
| Previous Daily High | 1827.87 |
| Previous Daily Low | 1808.99 |
| Previous Weekly High | 1847.59 |
| Previous Weekly Low | 1808.99 |
| Previous Monthly High | 1949.27 |
| Previous Monthly Low | 1823.76 |
| Daily Fibonacci 38.2% | 1816.20 |
| Daily Fibonacci 61.8% | 1820.66 |
| Daily Pivot Point S1 | 1804.00 |
| Daily Pivot Point S2 | 1797.05 |
| Daily Pivot Point S3 | 1785.12 |
| Daily Pivot Point R1 | 1822.88 |
| Daily Pivot Point R2 | 1834.81 |
| Daily Pivot Point R3 | 1841.76 |
[/s2If]
Join Our Telegram Group
")


