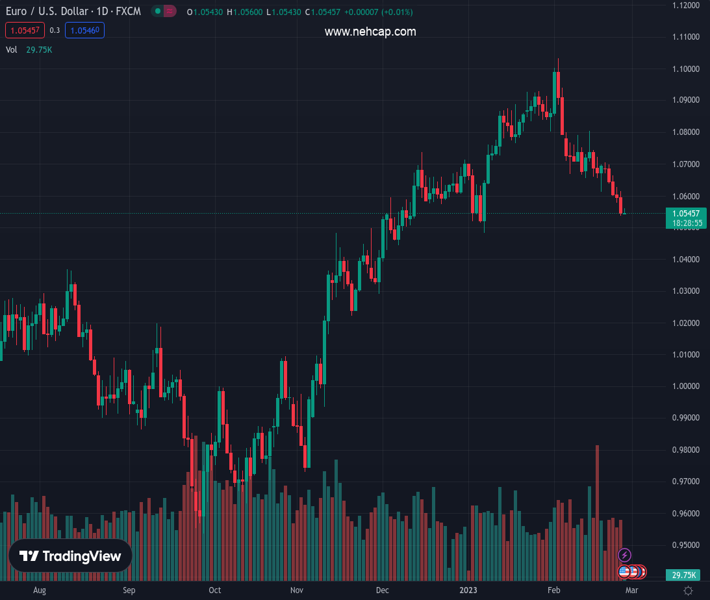
#EURUSD @ 1.05455 has turned sideways as investors await US Durable Goods Orders data for fresh impetus. (Pivot Orderbook analysis)
…
This is a premium post.
[s2If !current_user_can(access_s2member_level4)]Please register for PREMIUM VERSION HERE to read full post below containing analysis. In case of any error or you think you are not able to read the full post below, please email us at support#nehcap.com [lwa][/s2If] [s2If current_user_can(access_s2member_level4)]
- EUR/USD has turned sideways as investors await US Durable Goods Orders data for fresh impetus.
- Rising wage offerings by US firms to acquire talent in a tight labor market has propelled households’ spending.
- A range shift move by the RSI (14) indicates that the downside momentum has been triggered.
The pair currently trades last at 1.05455.
The previous day high was 1.0614 while the previous day low was 1.0536. The daily 38.2% Fib levels comes at 1.0566, expected to provide resistance. Similarly, the daily 61.8% fib level is at 1.0585, expected to provide resistance.
The EUR/USD pair is displaying a lackluster performance around 1.0550 in the Asian session. The volatility in the major currency pair has squeezed after a sheer downside inspired by the surprise jump in the United States consumer spending data released on Friday.
Rising wage offerings by the US firms to acquire talent in a tight labor market have propelled households’ spending. This has triggered fears of a continuation of the policy tightening spree by the Federal Reserve (Fed). The US Dollar Index (DXY) is demonstrating a subdued performance around 104.80 and is awaiting the release of the US Durable Goods Orders data for fresh cues.
Thursday’s Doji formation was confidently broken by the market participants, which resulted in a trend continuation toward the downside. The Euro bulls are expected to find a cushion around the horizontal support plotted from 15 November 2022 high around 1.0482.
Downward-sloping 10-and 20-period Exponential Moving Averages (EMAs) at 1.0631 and 1.0381 respectively, adds to the downside filters.
The Relative Strength Index (RSI) (14) has displayed a range shift move from the 40.00-60.00 range to the bearish range of 20.00-40.00, which indicates that the downside momentum has been triggered.
For further downside, a breakdown of February 24 low at 1.0536 will drag the asset towards 15 November 2022 high around 1.0482 followed by 16 November 2022 high at 1.0439.
On the flip side, a recovery move above the round-level resistance at 1.06000 will drive the asset toward February 22 high at 1.0658. A break above February 22 high will expose the asset to February 20 high around 1.0700.
.
Technical Levels: Supports and Resistances
EURUSD currently trading at 1.0553 at the time of writing. Pair opened at 1.0547 and is trading with a change of 0.06 % .
| Overview | Overview.1 | |
|---|---|---|
| 0 | Today last price | 1.0553 |
| 1 | Today Daily Change | 0.0006 |
| 2 | Today Daily Change % | 0.0600 |
| 3 | Today daily open | 1.0547 |
The pair is trading below its 20 Daily moving average @ 1.073, below its 50 Daily moving average @ 1.0726 , above its 100 Daily moving average @ 1.0451 and above its 200 Daily moving average @ 1.0331
| Trends | Trends.1 | |
|---|---|---|
| 0 | Daily SMA20 | 1.0730 |
| 1 | Daily SMA50 | 1.0726 |
| 2 | Daily SMA100 | 1.0451 |
| 3 | Daily SMA200 | 1.0331 |
The previous day high was 1.0614 while the previous day low was 1.0536. The daily 38.2% Fib levels comes at 1.0566, expected to provide resistance. Similarly, the daily 61.8% fib level is at 1.0585, expected to provide resistance.
Note the levels of interest below:
- Pivot support is noted at 1.0517, 1.0488, 1.0439
- Pivot resistance is noted at 1.0596, 1.0644, 1.0674
| Levels | Levels.1 |
|---|---|
| Previous Daily High | 1.0614 |
| Previous Daily Low | 1.0536 |
| Previous Weekly High | 1.0705 |
| Previous Weekly Low | 1.0536 |
| Previous Monthly High | 1.0930 |
| Previous Monthly Low | 1.0483 |
| Daily Fibonacci 38.2% | 1.0566 |
| Daily Fibonacci 61.8% | 1.0585 |
| Daily Pivot Point S1 | 1.0517 |
| Daily Pivot Point S2 | 1.0488 |
| Daily Pivot Point S3 | 1.0439 |
| Daily Pivot Point R1 | 1.0596 |
| Daily Pivot Point R2 | 1.0644 |
| Daily Pivot Point R3 | 1.0674 |
[/s2If]
Join Our Telegram Group
")


