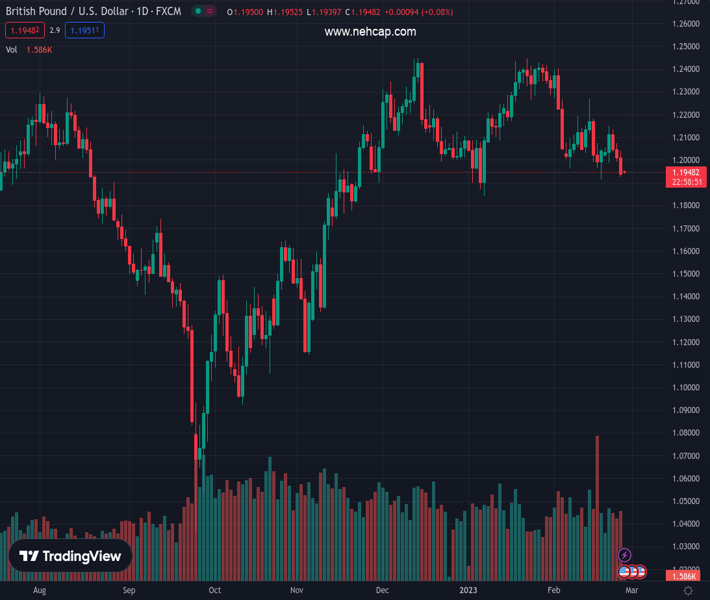
#GBPUSD @ 1.19476 is looking vulnerable above 1.1940 amid the risk-off market mood. (Pivot Orderbook analysis)
…
This is a premium post.
[s2If !current_user_can(access_s2member_level4)]Please register for PREMIUM VERSION HERE to read full post below containing analysis. In case of any error or you think you are not able to read the full post below, please email us at support#nehcap.com [lwa][/s2If] [s2If current_user_can(access_s2member_level4)]
- GBP/USD is looking vulnerable above 1.1940 amid the risk-off market mood.
- The USD Index is gathering strength to reclaim the immediate resistance of 105.00 amid hawkish Fed bets.
- Downward-sloping 20-and 50-period EMAs add to the downside filters.
The pair currently trades last at 1.19476.
The previous day high was 1.2042 while the previous day low was 1.1928. The daily 38.2% Fib levels comes at 1.1972, expected to provide resistance. Similarly, the daily 61.8% fib level is at 1.1999, expected to provide resistance.
The GBP/USD pair is displaying a volatility contraction around 1.1940 in the early Tokyo session. The Cable looks set to deliver further weakness as a fresh renewal in the Federal Reserve’s (Fed) hawkish bets has strengthened the US Dollar.
S&P500 futures witnessed immense pressure last week on hopes that more rates are in pipeline by the Fed as the United States inflation has turned persistent due to the strong labor market. The US Dollar Index (DXY) is gathering strength to reclaim the immediate resistance of 105.00. A jump in the monthly US core Personal Consumption Expenditure (PCE) price index by 0.6% sent 10-year US Treasury yields to near 3.95%.
GBP/USD is auctioning in an Inverted Flag chart pattern on an hourly scale. The chart pattern indicates a sheer consolidation that is followed by a breakdown. Usually, the consolidation phase of the chart pattern serves as an inventory adjustment in which those participants initiate shorts, which prefer to enter an auction after the establishment of a bearish bias.
It is worth noting that the Inverted Flag is forming around the horizontal support plotted from February 17 low at 1.1915. An inventory adjustment near crucial support indicates that bulls US Dollar bulls are gathering strength to discover more losses.
Downward-sloping 20-and 50-period Exponential Moving Averages (EMAs) at 1.2007 and 1.975 respectively, add to the downside filters.
The Relative Strength Index (RSI) (14) is oscillating in the 20.00-40.00 range, which indicates that the downside momentum is active.
A confident break below February 17 low at 1.1915 will drag the Cable firmly towards January 5 low at 1.1875 followed by the round-level support at 1.1800.
On the contrary, a move above February 24 high at 1.2040 will drive the asset towards February 23 high around 1.2080. A breach of the latter will expose the asset to February 21 high of around 1.2140.
Technical Levels: Supports and Resistances
GBPUSD currently trading at 1.1949 at the time of writing. Pair opened at 1.1943 and is trading with a change of 0.05 % .
| Overview | Overview.1 | |
|---|---|---|
| 0 | Today last price | 1.1949 |
| 1 | Today Daily Change | 0.0006 |
| 2 | Today Daily Change % | 0.0500 |
| 3 | Today daily open | 1.1943 |
The pair is trading below its 20 Daily moving average @ 1.2109, below its 50 Daily moving average @ 1.2149 , above its 100 Daily moving average @ 1.1941 and above its 200 Daily moving average @ 1.193
| Trends | Trends.1 | |
|---|---|---|
| 0 | Daily SMA20 | 1.2109 |
| 1 | Daily SMA50 | 1.2149 |
| 2 | Daily SMA100 | 1.1941 |
| 3 | Daily SMA200 | 1.1930 |
The previous day high was 1.2042 while the previous day low was 1.1928. The daily 38.2% Fib levels comes at 1.1972, expected to provide resistance. Similarly, the daily 61.8% fib level is at 1.1999, expected to provide resistance.
Note the levels of interest below:
- Pivot support is noted at 1.19, 1.1858, 1.1787
- Pivot resistance is noted at 1.2014, 1.2085, 1.2127
| Levels | Levels.1 |
|---|---|
| Previous Daily High | 1.2042 |
| Previous Daily Low | 1.1928 |
| Previous Weekly High | 1.2148 |
| Previous Weekly Low | 1.1928 |
| Previous Monthly High | 1.2448 |
| Previous Monthly Low | 1.1841 |
| Daily Fibonacci 38.2% | 1.1972 |
| Daily Fibonacci 61.8% | 1.1999 |
| Daily Pivot Point S1 | 1.1900 |
| Daily Pivot Point S2 | 1.1858 |
| Daily Pivot Point S3 | 1.1787 |
| Daily Pivot Point R1 | 1.2014 |
| Daily Pivot Point R2 | 1.2085 |
| Daily Pivot Point R3 | 1.2127 |
[/s2If]
Join Our Telegram Group
")


