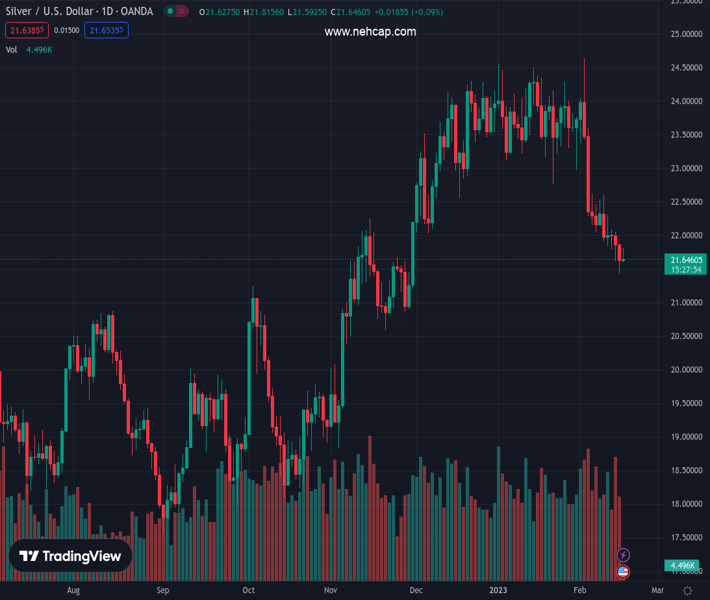
#XAGUSD @ 21.655 Silver price bounces off 10-week low to snap three-day downtrend. (Pivot Orderbook analysis)
…
This is a premium post.
[s2If !current_user_can(access_s2member_level4)]Please register for PREMIUM VERSION HERE to read full post below containing analysis. In case of any error or you think you are not able to read the full post below, please email us at support#nehcap.com [lwa][/s2If] [s2If current_user_can(access_s2member_level4)]
- Silver price bounces off 10-week low to snap three-day downtrend.
- Cautious optimism, pullback in yields underpin US Dollar’s retreat from multi-day high and favor XAG/USD buyers.
- China, second-tier US data may entertain Silver traders ahead of next week’s FOMC Minutes.
The pair currently trades last at 21.655.
The previous day high was 21.88 while the previous day low was 21.43. The daily 38.2% Fib levels comes at 21.6, expected to provide support. Similarly, the daily 61.8% fib level is at 21.71, expected to provide resistance.
Silver price (XAG/USD) retreats from intraday high but remains mildly bid near $21.70 during the early hours of Thursday’s European session.
The bright metal’s latest pullback, which marks the first daily loss in four, could be the resettlement of the previous bias as Western traders return to their desks. However, a lack of major data/events joins the cautious optimism backed by Chinese news to put a floor under the XAG/USD price.
The risk profile, however, improves as Chinese President Xi Jinping shows readiness to deepen industrial and investment cooperation with Asia. On the same line were the upbeat comments from Chinese Finance Minister Liu Kun who said that the 2023 fiscal revenue will grow this year, though the growth rate will not be too high, per the Chinese state media.
It should be noted that the strong US data bolstered the hawkish Fed bias and weighed on the Silver price to print a 10-week low the previous day. Among the key data, US Retail Sales for January and the NY Empire State Manufacturing Index for February gained major attention. Following the data, the market’s bets on the Fed’s next moves, as per the FEDWATCH tool of Reuters, suggest the US central bank’s benchmark rate is to peak in July around 5.25% versus the December Federal Reserve prediction of 5.10% top rate.
Amid these plays, the S&P 500 Futures print mild gains around 4,165 while extending the previous day’s gains whereas the US 10-year Treasury bond yields retreat following the run-up to a 1.5-month high marked on Wednesday, down two basis points to near 3.78% by the press time. Further, the US Dollar Index (DXY) prints 0.15% intraday loss while easing to 103.70 at the latest, after rising to the 1.5-month high the previous day.
Given the light calendar for the day and the week, the Silver price may remain depressed while the second-tier US data concerning the housing market, industrial activity and producer prices can entertain traders. However, major attention will be given to the next week’s Minutes of the latest Federal Open Market Committee (FOMC) monetary policy meeting.
Despite the corrective bounce amid oversold RSI (14) on the daily chart, the Silver price remains below the 100-DMA hurdle, currently around the $22.00 round figure, which in turn keeps the XAG/USD sellers hopeful to visiting the 200-DMA level surrounding $21.00.
Technical Levels: Supports and Resistances
XAGUSD currently trading at 21.68 at the time of writing. Pair opened at 21.65 and is trading with a change of 0.14% % .
| Overview | Overview.1 | |
|---|---|---|
| 0 | Today last price | 21.68 |
| 1 | Today Daily Change | 0.03 |
| 2 | Today Daily Change % | 0.14% |
| 3 | Today daily open | 21.65 |
The pair is trading below its 20 Daily moving average @ 22.98, below its 50 Daily moving average @ 23.4 , below its 100 Daily moving average @ 21.93 and above its 200 Daily moving average @ 21.01
| Trends | Trends.1 | |
|---|---|---|
| 0 | Daily SMA20 | 22.98 |
| 1 | Daily SMA50 | 23.40 |
| 2 | Daily SMA100 | 21.93 |
| 3 | Daily SMA200 | 21.01 |
The previous day high was 21.88 while the previous day low was 21.43. The daily 38.2% Fib levels comes at 21.6, expected to provide support. Similarly, the daily 61.8% fib level is at 21.71, expected to provide resistance.
Note the levels of interest below:
- Pivot support is noted at 21.43, 21.2, 20.97
- Pivot resistance is noted at 21.88, 22.11, 22.34
| Levels | Levels.1 |
|---|---|
| Previous Daily High | 21.88 |
| Previous Daily Low | 21.43 |
| Previous Weekly High | 22.62 |
| Previous Weekly Low | 21.84 |
| Previous Monthly High | 24.55 |
| Previous Monthly Low | 22.76 |
| Daily Fibonacci 38.2% | 21.60 |
| Daily Fibonacci 61.8% | 21.71 |
| Daily Pivot Point S1 | 21.43 |
| Daily Pivot Point S2 | 21.20 |
| Daily Pivot Point S3 | 20.97 |
| Daily Pivot Point R1 | 21.88 |
| Daily Pivot Point R2 | 22.11 |
| Daily Pivot Point R3 | 22.34 |
[/s2If]
Join Our Telegram Group
")


