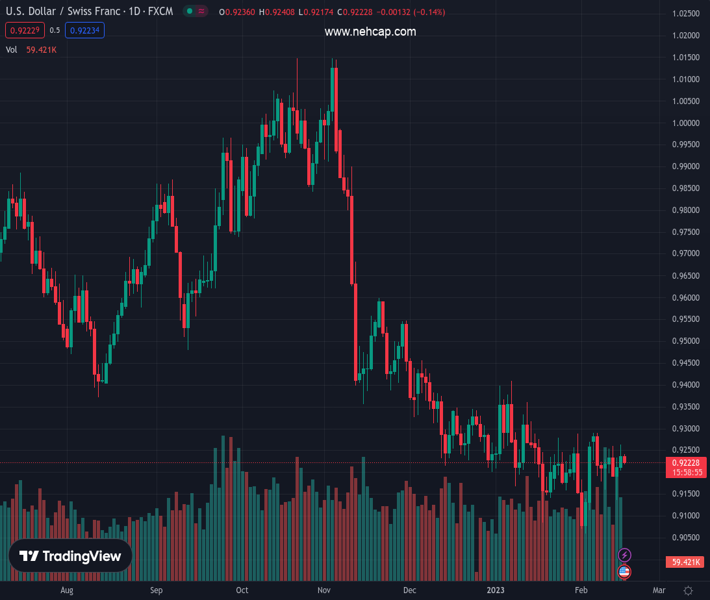
#USDCHF @ 0.92225 clings to mild losses while snapping two-day winning streak. (Pivot Orderbook analysis)
…
This is a premium post.
[s2If !current_user_can(access_s2member_level4)]Please register for PREMIUM VERSION HERE to read full post below containing analysis. In case of any error or you think you are not able to read the full post below, please email us at support#nehcap.com [lwa][/s2If] [s2If current_user_can(access_s2member_level4)]
- USD/CHF clings to mild losses while snapping two-day winning streak.
- Retreat in US Treasury bond yields, DXY joins failure to cross six-week-old resistance to trigger pullback moves.
- China, US debt-ceiling talks seem underpinning cautious optimism but hawkish Fed bets keep buyers hopeful.
The pair currently trades last at 0.92225.
The previous day high was 0.9263 while the previous day low was 0.9212. The daily 38.2% Fib levels comes at 0.9243, expected to provide resistance. Similarly, the daily 61.8% fib level is at 0.9231, expected to provide resistance.
USD/CHF prints mild losses around 0.9225 as it portrays the first daily fall in three during early Thursday in Europe. In doing so, the Swiss Franc (CHF) pair benefits from the broad US Dollar pullback amid inactive markets while consolidating the latest gains.
Market sentiment improves as Chinese President Xi Jinping shows readiness to deepen industrial and investment cooperation with Asia. Following him were upbeat comments from Chinese Finance Minister Liu Kun who said that the 2023 fiscal revenue will grow this year, though the growth rate will not be too high, per the Chinese state media.
On a different page, the chatter surrounding the US debt-ceiling crisis, as warned by the US Congressional Budget Office (CBO) on Wednesday per Reuters, seemed to have raised hopes of a faster solution to the big problem in the upcoming days and probed the US Treasury bond yields’ upside.
The same joined a lack of major data/events to challenge the US Dollar Index (DXY) that retreat drops 0.20% to 103.65 at the latest, after rising to the 1.5-month high the previous day.
It should be noted that the strong US data propelled the US bond yield and the greenback the previous day amid escalating hopes of more rate hikes from the Fed. On Wednesday, US Retail Sales growth jumped to 3.0% YoY in January versus 1.8% expected and -1.1% prior. Further, The Retail Sales ex-Autos grew by 2.3% in the same period, compared to analysts’ estimate of +0.8%. On the same line, the NY Empire State Manufacturing Index for February improved to a three-month high of -5.8 versus -18.0 expected and -32.9 market forecasts. Alternatively, the US Industrial Production marked 0.0% MoM figures for January, compared to analysts’ estimate of 0.5% and -0.7% previous readings, but failed to push back the hawkish bias surrounding the Federal Reserve’s (Fed) next move. That said, the market’s bets on the Fed’s next moves, as per the FEDWATCH tool of Reuters, suggest the US central bank’s benchmark rate is to peak in July around 5.25% versus the December Federal Reserve prediction of 5.10% top rate.
Against this backdrop, the S&P 500 Futures print mild gains around 4,165 while extending the previous day’s gains whereas the US 10-year Treasury bond yields retreat following the run-up to a 1.5-month high marked on Wednesday, down two basis points to near 3.78% by the press time.
Looking ahead, a light calendar may allow the USD/CHF to remain depressed while the second-tier US data concerning the housing market, industrial activity and producer prices can entertain traders ahead of the next week’s Minutes of the latest Federal Open Market Committee (FOMC) monetary policy meeting.
A downward-sloping trend line from January 06 joins the 50-DMA to highlight 0.9250 as the key upside hurdle for the USD/CHF buyers to cross before taking control. Even so, bullish MACD signals and a steady RSI (14) line hints at the pair’s upside potential.
Technical Levels: Supports and Resistances
USDCHF currently trading at 0.9224 at the time of writing. Pair opened at 0.9237 and is trading with a change of -0.14% % .
| Overview | Overview.1 | |
|---|---|---|
| 0 | Today last price | 0.9224 |
| 1 | Today Daily Change | -0.0013 |
| 2 | Today Daily Change % | -0.14% |
| 3 | Today daily open | 0.9237 |
The pair is trading above its 20 Daily moving average @ 0.9206, below its 50 Daily moving average @ 0.9254 , below its 100 Daily moving average @ 0.9505 and below its 200 Daily moving average @ 0.9594
| Trends | Trends.1 | |
|---|---|---|
| 0 | Daily SMA20 | 0.9206 |
| 1 | Daily SMA50 | 0.9254 |
| 2 | Daily SMA100 | 0.9505 |
| 3 | Daily SMA200 | 0.9594 |
The previous day high was 0.9263 while the previous day low was 0.9212. The daily 38.2% Fib levels comes at 0.9243, expected to provide resistance. Similarly, the daily 61.8% fib level is at 0.9231, expected to provide resistance.
Note the levels of interest below:
- Pivot support is noted at 0.9212, 0.9186, 0.916
- Pivot resistance is noted at 0.9263, 0.9288, 0.9314
| Levels | Levels.1 |
|---|---|
| Previous Daily High | 0.9263 |
| Previous Daily Low | 0.9212 |
| Previous Weekly High | 0.9291 |
| Previous Weekly Low | 0.9160 |
| Previous Monthly High | 0.9410 |
| Previous Monthly Low | 0.9085 |
| Daily Fibonacci 38.2% | 0.9243 |
| Daily Fibonacci 61.8% | 0.9231 |
| Daily Pivot Point S1 | 0.9212 |
| Daily Pivot Point S2 | 0.9186 |
| Daily Pivot Point S3 | 0.9160 |
| Daily Pivot Point R1 | 0.9263 |
| Daily Pivot Point R2 | 0.9288 |
| Daily Pivot Point R3 | 0.9314 |
[/s2If]
Join Our Telegram Group
")


