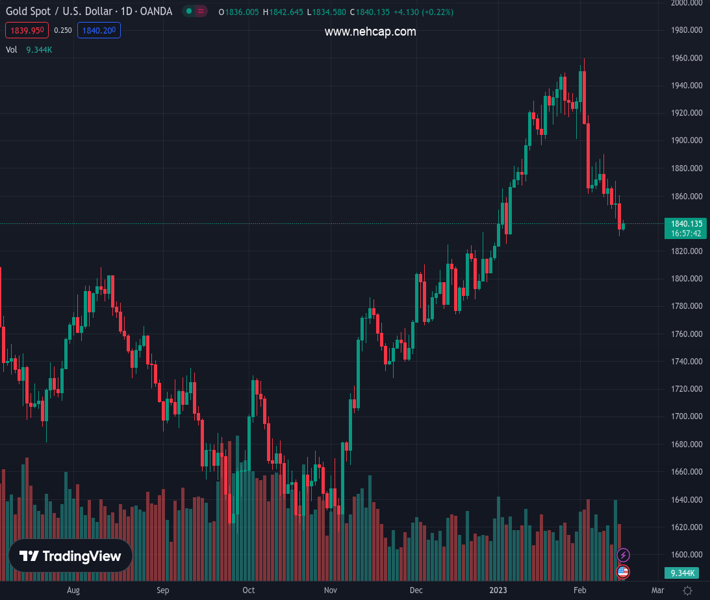
#XAUUSD @ 1,839.90 Gold price bounces off six-week low to pare the biggest daily loss in a fortnight., @nehcap view: Further downside expected (Pivot Orderbook analysis)
…
This is a premium post.
[s2If !current_user_can(access_s2member_level4)]Please register for PREMIUM VERSION HERE to read full post below containing analysis. In case of any error or you think you are not able to read the full post below, please email us at support#nehcap.com [lwa][/s2If] [s2If current_user_can(access_s2member_level4)]
- Gold price bounces off six-week low to pare the biggest daily loss in a fortnight.
- China-led cautious optimism in markets joins US debt ceiling concerns to probe US bond bears and US Dollar buyers.
- Second-tier US data, risk catalysts eyed amid a light calendar.
The pair currently trades last at 1839.90.
The previous day high was 1860.14 while the previous day low was 1830.6. The daily 38.2% Fib levels comes at 1841.88, expected to provide resistance. Similarly, the daily 61.8% fib level is at 1848.86, expected to provide resistance.
Gold price (XAU/USD) prints mild gains around $1,840 as traders lick their wounds amid early Thursday’s sluggish trading. In doing so, the bright metal pares the longest daily fall in a fortnight by taking clues from cautious optimism in the markets and a retreat of the US Dollar.
That said, headlines surrounding China and the US debt ceiling seem to have favored the latest improvement in the risk profile. That said, China President Xi Jinping crossed wires while showing readiness to deepen industrial and investment cooperation with Asia. Following him were upbeat comments from Chinese Finance Minister Liu Kun who said that the 2023 fiscal revenue will grow this year, though the growth rate will not be too high, per the Chinese state media. Furthermore, the chatter surrounding the US debt-ceiling crisis, as warned by the US Congressional Budget Office (CBO) on Wednesday per Reuters, seemed to have raised hopes of a faster solution to the big problem in the upcoming days and probed the US Treasury bond yields’ upside.
It should be noted that the World Gold Council’s (WGC) update suggesting China’s heavy Gold imports in 2022, the biggest since 2018, also seemed to have put a floor under the XAU/USD price, especially after the previous day’s fall.
Above all, the US data-led hawkish Fed bias and a run-up in the US Treasury bond yields seem to challenge the Gold buyers.
Against this backdrop, the S&P 500 Futures print mild gains around 4,165 while extending the previous day’s gains whereas the US 10-year Treasury bond yields retreat following the run-up to a 1.5-month high marked on Wednesday, down two basis points to near 3.78% by the press time. That said, the US Dollar Index (DXY) dropped 0.20% to 103.65 at the latest, after rising to the 1.5-month high the previous day.
Moving on, Gold traders should pay attention to second-tier US data concerning the housing market, industrial activity and producer prices for fresh impulse.
Despite the latest rebound of the Gold price, a two-week-long descending resistance line, around $1,850 by the press time, challenges the buyers. Also doubting the upside bias is the bearish MACD signals and the downbeat RSI (14), but not oversold.
Even if the Gold price manages to cross the $1,850 hurdle, the 50-DMA level surrounding $1,862 and the previous support line from late November 2022, close to $1,905 at the latest, could test the XAU/USD bulls before giving them control.
Alternatively, Gold sellers may wait for a clear downside break of a two-month-old horizontal support area around $1,820 before excelling their dominance.
In that case, the $1,800 round figure and $1,750 may test the XAU/USD bears before directing them to the late November 2022 swing low of around $1,720.
Trend: Further downside expected
Technical Levels: Supports and Resistances
XAUUSD currently trading at 1839.72 at the time of writing. Pair opened at 1837.62 and is trading with a change of 0.11 % .
| Overview | Overview.1 | |
|---|---|---|
| 0 | Today last price | 1839.72 |
| 1 | Today Daily Change | 2.10 |
| 2 | Today Daily Change % | 0.11 |
| 3 | Today daily open | 1837.62 |
The pair is trading below its 20 Daily moving average @ 1900.11, below its 50 Daily moving average @ 1860.08 , above its 100 Daily moving average @ 1782.92 and above its 200 Daily moving average @ 1775.83
| Trends | Trends.1 | |
|---|---|---|
| 0 | Daily SMA20 | 1900.11 |
| 1 | Daily SMA50 | 1860.08 |
| 2 | Daily SMA100 | 1782.92 |
| 3 | Daily SMA200 | 1775.83 |
The previous day high was 1860.14 while the previous day low was 1830.6. The daily 38.2% Fib levels comes at 1841.88, expected to provide resistance. Similarly, the daily 61.8% fib level is at 1848.86, expected to provide resistance.
Note the levels of interest below:
- Pivot support is noted at 1825.43, 1813.25, 1795.89
- Pivot resistance is noted at 1854.97, 1872.33, 1884.51
| Levels | Levels.1 |
|---|---|
| Previous Daily High | 1860.14 |
| Previous Daily Low | 1830.60 |
| Previous Weekly High | 1890.27 |
| Previous Weekly Low | 1852.84 |
| Previous Monthly High | 1949.27 |
| Previous Monthly Low | 1823.76 |
| Daily Fibonacci 38.2% | 1841.88 |
| Daily Fibonacci 61.8% | 1848.86 |
| Daily Pivot Point S1 | 1825.43 |
| Daily Pivot Point S2 | 1813.25 |
| Daily Pivot Point S3 | 1795.89 |
| Daily Pivot Point R1 | 1854.97 |
| Daily Pivot Point R2 | 1872.33 |
| Daily Pivot Point R3 | 1884.51 |
[/s2If]
Join Our Telegram Group
")


