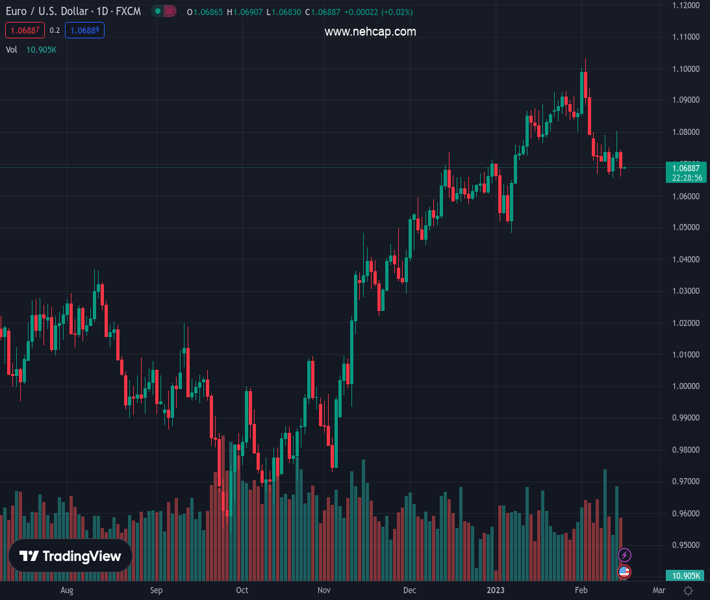
#EURUSD @ 1.06867 seeks clear direction after falling the most in a week. (Pivot Orderbook analysis)
…
This is a premium post.
[s2If !current_user_can(access_s2member_level4)]Please register for PREMIUM VERSION HERE to read full post below containing analysis. In case of any error or you think you are not able to read the full post below, please email us at support#nehcap.com [lwa][/s2If] [s2If current_user_can(access_s2member_level4)]
- EUR/USD seeks clear direction after falling the most in a week.
- US data renew hawkish Fed concerns and propel Treasury bond yields, US Dollar.
- ECB’s Lagarde reiterates the call for 50 bps rate hike in March.
- Second-tier data/events eyed for fresh impulse, risk catalysts are the key.
The pair currently trades last at 1.06867.
The previous day high was 1.0805 while the previous day low was 1.0707. The daily 38.2% Fib levels comes at 1.0767, expected to provide resistance. Similarly, the daily 61.8% fib level is at 1.0744, expected to provide resistance.
EUR/USD makes rounds to 1.0690 while struggling to extend the late Wednesday’s corrective bounce during early Thursday. That said, the major currency pair dropped the most in a week after the US data propelled the Fed bets and allowed the US Treasury bond yields, as well as the US Dollar, to refresh multi-day high. However, the recently hawkish comments from European Central Bank (ECB) President Christine Lagarde seemed to have put a floor under the prices.
That said, the US 10-year Treasury bond yields rose to a fresh six-week high and the US Dollar Index (DXY) also jumped to a 1.5-month top after the key US data hints at a further increase in the Federal Reserve’s (Fed) interest rates.
On Wednesday, US Retail Sales growth jumped to 3.0% YoY in January versus 1.8% expected and -1.1% prior. Further, The Retail Sales ex-Autos grew by 2.3% in the same period, compared to analysts’ estimate of +0.8%. On the same line, the NY Empire State Manufacturing Index for February improved to a three-month high of -5.8 versus -18.0 expected and -32.9 market forecasts. Alternatively, the US Industrial Production marked 0.0% MoM figures for January, compared to analysts’ estimate of 0.5% and -0.7% previous readings, but failed to push back the hawkish bias surrounding the Federal Reserve’s (Fed) next move.
Following the data, the market’s bets on the Fed’s next moves, as per the FEDWATCH tool of Reuters, suggest that the US central bank rates are to peak in July around 5.25% versus the December Federal Reserve prediction of 5.10% top rate.
On the other hand, ECB’s Lagarde stated that even though most measures of longer-term inflation expectations currently stand at around 2%, these measures warrant continued monitoring. The policymaker mentioned, “Price pressures remain strong and underlying inflation is still high,” while showing her intention to lift rates by 50 basis points at the March meeting.
Amid these plays, Wall Street benchmarks closed with mild gains, following the day-end recovery, but S&P 500 Futures hesitate in following suit.
Looking forward, the ECB’s monthly bulletin and multiple ECB speakers can offer an entertaining day together with the second-tier US data concerning the housing market, industrial activity and producer prices.
EUR/USD seesaws between the 21-day Exponential Moving Average (EMA) and the 50-day EMA, respectively near 1.0760 and 1.0680 as bears keep the reins.
Technical Levels: Supports and Resistances
EURUSD currently trading at 1.0689 at the time of writing. Pair opened at 1.0738 and is trading with a change of -0.46% % .
| Overview | Overview.1 | |
|---|---|---|
| 0 | Today last price | 1.0689 |
| 1 | Today Daily Change | -0.0049 |
| 2 | Today Daily Change % | -0.46% |
| 3 | Today daily open | 1.0738 |
The pair is trading below its 20 Daily moving average @ 1.0818, below its 50 Daily moving average @ 1.0716 , above its 100 Daily moving average @ 1.0385 and above its 200 Daily moving average @ 1.0325
| Trends | Trends.1 | |
|---|---|---|
| 0 | Daily SMA20 | 1.0818 |
| 1 | Daily SMA50 | 1.0716 |
| 2 | Daily SMA100 | 1.0385 |
| 3 | Daily SMA200 | 1.0325 |
The previous day high was 1.0805 while the previous day low was 1.0707. The daily 38.2% Fib levels comes at 1.0767, expected to provide resistance. Similarly, the daily 61.8% fib level is at 1.0744, expected to provide resistance.
Note the levels of interest below:
- Pivot support is noted at 1.0695, 1.0652, 1.0597
- Pivot resistance is noted at 1.0793, 1.0848, 1.0891
| Levels | Levels.1 |
|---|---|
| Previous Daily High | 1.0805 |
| Previous Daily Low | 1.0707 |
| Previous Weekly High | 1.0799 |
| Previous Weekly Low | 1.0666 |
| Previous Monthly High | 1.0930 |
| Previous Monthly Low | 1.0483 |
| Daily Fibonacci 38.2% | 1.0767 |
| Daily Fibonacci 61.8% | 1.0744 |
| Daily Pivot Point S1 | 1.0695 |
| Daily Pivot Point S2 | 1.0652 |
| Daily Pivot Point S3 | 1.0597 |
| Daily Pivot Point R1 | 1.0793 |
| Daily Pivot Point R2 | 1.0848 |
| Daily Pivot Point R3 | 1.0891 |
[/s2If]
Join Our Telegram Group
")


