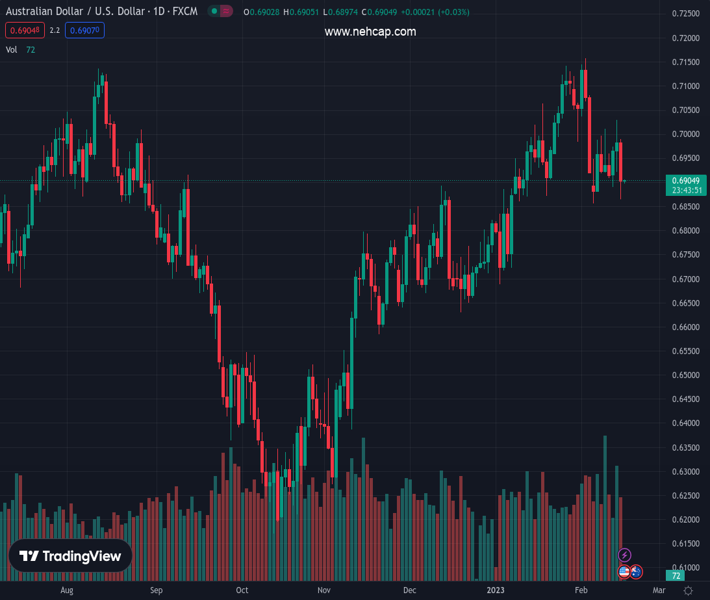
#AUDUSD @ 0.69029 consolidates the biggest daily loss in a fortnight at weekly low. (Pivot Orderbook analysis)
…
This is a premium post.
[s2If !current_user_can(access_s2member_level4)]Please register for PREMIUM VERSION HERE to read full post below containing analysis. In case of any error or you think you are not able to read the full post below, please email us at support#nehcap.com [lwa][/s2If] [s2If current_user_can(access_s2member_level4)]
- AUD/USD consolidates the biggest daily loss in a fortnight at weekly low.
- Strong US data saw Treasury bond yields, US Dollar run-up.
- RBA’s Lowe fails to impress hawks despite signaling inflation fears.
- Australia employment data for January appears the key for immediate directions.
The pair currently trades last at 0.69029.
The previous day high was 0.703 while the previous day low was 0.6922. The daily 38.2% Fib levels comes at 0.6988, expected to provide resistance. Similarly, the daily 61.8% fib level is at 0.6963, expected to provide resistance.
AUD/USD seesaws around 0.6900 as it struggles to defend late Wednesday’s corrective bounce off the weekly low ahead of the key Aussie jobs report. That said, the Aussie pair dropped the most in two weeks the previous day amid broad US Dollar strength, backed by upbeat data, as well as the Reserve Bank of Australia (RBA) Governor Philip Lowe’s failure to convince the policy hawks.
That said, US Retail Sales growth jumped to 3.0% YoY in January versus 1.8% expected and -1.1% prior. Further, The Retail Sales ex-Autos grew by 2.3% in the same period, compared to analysts’ estimate of +0.8%. On the same line, the NY Empire State Manufacturing Index for February improved to a three-month high of -5.8 versus -18.0 expected and -32.9 market forecasts. Alternatively, the US Industrial Production marked 0.0% MoM figures for January, compared to analysts’ estimate of 0.5% and -0.7% previous readings, but failed to push back the hawkish bias surrounding the Federal Reserve’s (Fed) next move.
At home, RBA’s Lowe Lowe said inflation is way too high and that it needs to come down. The policymaker also stated, “We’re still unsure how far rates can go,” and added, “Rates have not yet reached their peak.”
It should be noted that the latest round of the US data, especially in the last two weeks, have been upbeat enough to renew the calls for a higher Fed rate, which in turn propel the US Treasury bond yields and the US Dollar. The same, however, exert downside pressure on the market’s sentiment and the riskier assets like the Australia Dollar and equities.
Amid these plays, Wall Street closed mild gains after the day-end recovery whereas the US 10-year Treasury bond yields stay firmer around the six-week high, which in turn portrays the risk-off mood and weighs on the AUD/USD price.
Given the US data backing the hawkish concerns surrounding the Federal Reserve (Fed) and the RBA’s inability to convince the policy hawks, AUD/USD traders will pay attention to January’s employment numbers for fresh impulse. That said, the headline Employment Change is likely to reverse the previous contraction of 14.06K with an addition of 20.0K while the Unemployment Rate is expected to remain unchanged at 3.5%. As a result, the Aussie pair may extend the latest corrective bounce in case the scheduled jobs report match or surpass the anticipated positive figures.
Although a U-turn from the 3.5-month-old previous support line keeps AUD/USD bears hopeful, the 50-DMA and the 200-DMA challenge the Aussie pair’s further downside around 0.6885 and 0.6800 respectively.
Technical Levels: Supports and Resistances
AUDUSD currently trading at 0.6903 at the time of writing. Pair opened at 0.6992 and is trading with a change of -1.27% % .
| Overview | Overview.1 | |
|---|---|---|
| 0 | Today last price | 0.6903 |
| 1 | Today Daily Change | -0.0089 |
| 2 | Today Daily Change % | -1.27% |
| 3 | Today daily open | 0.6992 |
The pair is trading below its 20 Daily moving average @ 0.7002, above its 50 Daily moving average @ 0.688 , above its 100 Daily moving average @ 0.6695 and above its 200 Daily moving average @ 0.6806
| Trends | Trends.1 | |
|---|---|---|
| 0 | Daily SMA20 | 0.7002 |
| 1 | Daily SMA50 | 0.6880 |
| 2 | Daily SMA100 | 0.6695 |
| 3 | Daily SMA200 | 0.6806 |
The previous day high was 0.703 while the previous day low was 0.6922. The daily 38.2% Fib levels comes at 0.6988, expected to provide resistance. Similarly, the daily 61.8% fib level is at 0.6963, expected to provide resistance.
Note the levels of interest below:
- Pivot support is noted at 0.6932, 0.6873, 0.6824
- Pivot resistance is noted at 0.7041, 0.7089, 0.7149
| Levels | Levels.1 |
|---|---|
| Previous Daily High | 0.7030 |
| Previous Daily Low | 0.6922 |
| Previous Weekly High | 0.7011 |
| Previous Weekly Low | 0.6856 |
| Previous Monthly High | 0.7143 |
| Previous Monthly Low | 0.6688 |
| Daily Fibonacci 38.2% | 0.6988 |
| Daily Fibonacci 61.8% | 0.6963 |
| Daily Pivot Point S1 | 0.6932 |
| Daily Pivot Point S2 | 0.6873 |
| Daily Pivot Point S3 | 0.6824 |
| Daily Pivot Point R1 | 0.7041 |
| Daily Pivot Point R2 | 0.7089 |
| Daily Pivot Point R3 | 0.7149 |
[/s2If]
Join Our Telegram Group
")


