The index maintains the erratic activity around 103.00 so far. (Pivot Orderbook analysis)
…
This is a premium post.
[s2If !current_user_can(access_s2member_level4)]Please register for PREMIUM VERSION HERE to read full post below containing analysis. In case of any error or you think you are not able to read the full post below, please email us at support#nehcap.com [lwa][/s2If] [s2If current_user_can(access_s2member_level4)]
- The index maintains the erratic activity around 103.00 so far.
- The monthly high near 104.00 continues to cap the upside.
The pair currently trades last at 103.52.
The previous day high was 103.52 while the previous day low was 102.54. The daily 38.2% Fib levels comes at 102.92, expected to provide support. Similarly, the daily 61.8% fib level is at 103.15, expected to provide support.
DXY reverses the recent 2-day retracement and regains the 103.60 region on Wednesday.
The ongoing price action leaves the door open to the continuation of the consolidative note for the time being. Occasional bouts of strength, however, are expected to remain limited by the proximity of the 104.00 zone, or February highs (February 7).
In the longer run, while below the 200-day SMA at 106.45, the outlook for the index remains negative.
Technical Levels: Supports and Resistances
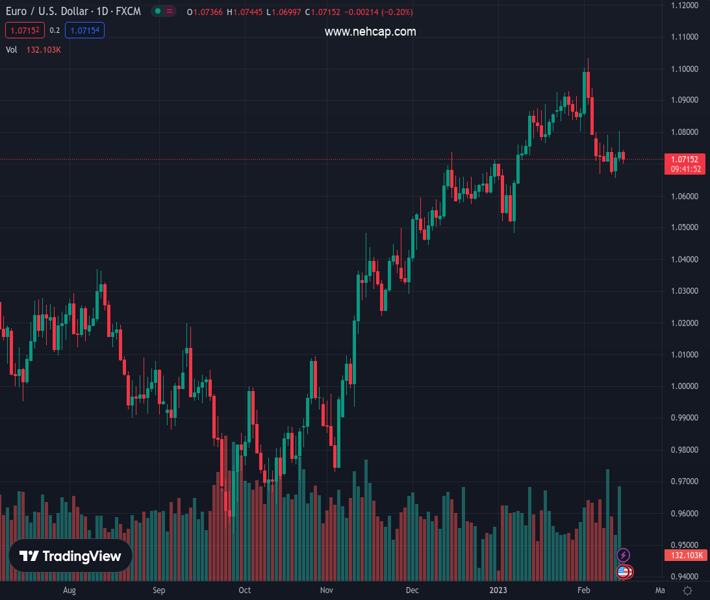
EURUSD currently trading at 103.52 at the time of writing. Pair opened at 103.25 and is trading with a change of 0.26 % .
| Overview | Overview.1 | |
|---|---|---|
| 0 | Today last price | 103.52 |
| 1 | Today Daily Change | 47.00 |
| 2 | Today Daily Change % | 0.26 |
| 3 | Today daily open | 103.25 |
The pair is trading above its 20 Daily moving average @ 102.49, above its 50 Daily moving average @ 103.39 , below its 100 Daily moving average @ 105.88 and below its 200 Daily moving average @ 106.73
| Trends | Trends.1 | |
|---|---|---|
| 0 | Daily SMA20 | 102.49 |
| 1 | Daily SMA50 | 103.39 |
| 2 | Daily SMA100 | 105.88 |
| 3 | Daily SMA200 | 106.73 |
The previous day high was 103.52 while the previous day low was 102.54. The daily 38.2% Fib levels comes at 102.92, expected to provide support. Similarly, the daily 61.8% fib level is at 103.15, expected to provide support.
Note the levels of interest below:
- Pivot support is noted at 102.69, 102.13, 101.72
- Pivot resistance is noted at 103.67, 104.08, 104.64
| Levels | Levels.1 |
|---|---|
| Previous Daily High | 103.52 |
| Previous Daily Low | 102.54 |
| Previous Weekly High | 103.96 |
| Previous Weekly Low | 102.64 |
| Previous Monthly High | 105.63 |
| Previous Monthly Low | 101.50 |
| Daily Fibonacci 38.2% | 102.92 |
| Daily Fibonacci 61.8% | 103.15 |
| Daily Pivot Point S1 | 102.69 |
| Daily Pivot Point S2 | 102.13 |
| Daily Pivot Point S3 | 101.72 |
| Daily Pivot Point R1 | 103.67 |
| Daily Pivot Point R2 | 104.08 |
| Daily Pivot Point R3 | 104.64 |
[/s2If]
Join Our Telegram Group
")


