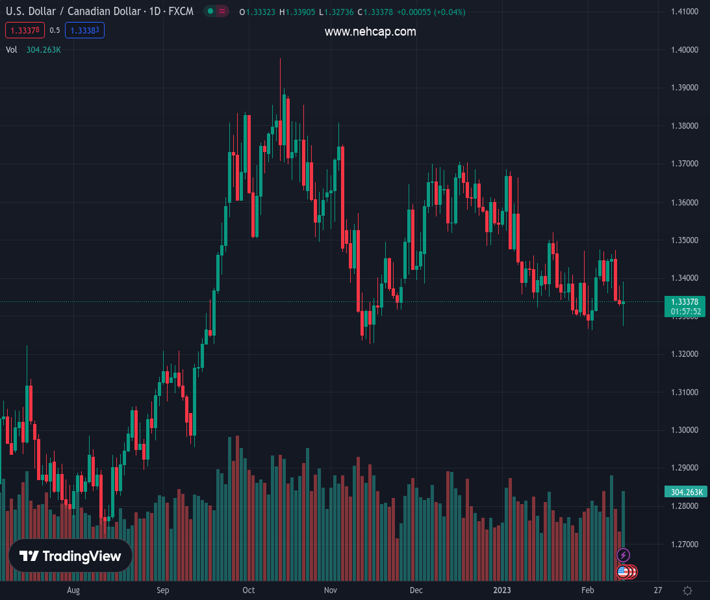
#USDCAD @ 1.33374 snapped two days of losses and rose towards 1.3350s on US inflation data. (Pivot Orderbook analysis)
…
This is a premium post.
[s2If !current_user_can(access_s2member_level4)]Please register for PREMIUM VERSION HERE to read full post below containing analysis. In case of any error or you think you are not able to read the full post below, please email us at support#nehcap.com [lwa][/s2If] [s2If current_user_can(access_s2member_level4)]
- USD/CAD snapped two days of losses and rose towards 1.3350s on US inflation data.
- The US Consumer Price Index for January was mixed, with MoM aligned with estimates, while YoY figures were above forecasts.
- USD/CAD Price Analysis: Set for higher prices as a bullish engulfing pattern forms.
The pair currently trades last at 1.33374.
The previous day high was 1.338 while the previous day low was 1.3325. The daily 38.2% Fib levels comes at 1.3346, expected to provide resistance. Similarly, the daily 61.8% fib level is at 1.3359, expected to provide resistance.
The USD/CAD braces to its early gains in the day, though it retreated after hitting a daily high of 1.3390 on news that inflation edged down, though it was above expectations. That increased demand for the greenback, which has remained bid, during the New York session. Hence, the USD/CAD is trading at 1.3352 after hitting a low of 1.3273
The US Bureau of Labor Statistics (BLS) reported that the Consumer Price Index (CPI) for January increased by 6.4% compared to the same period last year, which was higher than the predicted rate of 6.2%. Similarly, the core CPI rose by 5.6% year-on-year, above the estimated figure of 5.5%. Month-over-month data readings were consistent with the predicted values.
Following the release of the US inflation report, a slew of Federal Reserve (Fed) policymakers had crossed newswires. Officials expressed that the US central bank is not done hiking rates while emphasizing that inflation is high and that further tightening is needed. They stressed that higher-for-longer is their playbook and are not expecting to cut rates in 2023.
Given the backdrop, the USD/CAD remained on the front foot and was bolstered by falling US crude oil prices, with WTI dropping 1.53%. Money market futures estimate the Federal Reserve will hike above the 5% threshold, expecting the first rate cut by December 2023.
Aside from this, even though the Bank of Canada (BoC) is foreseen to raise rates further, the interest rate differential between both countries would benefit the US Dollar (USD). Therefore, further upside is expected on the USD/CAD pair.
The Canadian docket will feature housing and manufacturing data. The US economic calendar will unveil Retail Sales, the NY Fed Manufacturing Index, and Industrial Production.
The USD/CAD daily chart suggests an upward reversion is forming, as Tuesday’s price action is engulfing the previous day. Therefore, a bullish engulfing candle pattern might open the door for further upside though solid resistance remains. The 20-day Exponential Moving Average (EMA), at around 1.3386, would be the bears’ first line of defense. A breach of the latter and 1.3400 is up for grabs, closely followed by the 100 and 50-day EMAs, each at 1.3408 and 1.3430.
Technical Levels: Supports and Resistances
USDCAD currently trading at 1.3355 at the time of writing. Pair opened at 1.3336 and is trading with a change of 0.14 % .
| Overview | Overview.1 | |
|---|---|---|
| 0 | Today last price | 1.3355 |
| 1 | Today Daily Change | 0.0019 |
| 2 | Today Daily Change % | 0.1400 |
| 3 | Today daily open | 1.3336 |
The pair is trading below its 20 Daily moving average @ 1.3382, below its 50 Daily moving average @ 1.3487 , below its 100 Daily moving average @ 1.3529 and above its 200 Daily moving average @ 1.3238
| Trends | Trends.1 | |
|---|---|---|
| 0 | Daily SMA20 | 1.3382 |
| 1 | Daily SMA50 | 1.3487 |
| 2 | Daily SMA100 | 1.3529 |
| 3 | Daily SMA200 | 1.3238 |
The previous day high was 1.338 while the previous day low was 1.3325. The daily 38.2% Fib levels comes at 1.3346, expected to provide resistance. Similarly, the daily 61.8% fib level is at 1.3359, expected to provide resistance.
Note the levels of interest below:
- Pivot support is noted at 1.3314, 1.3292, 1.3259
- Pivot resistance is noted at 1.3369, 1.3402, 1.3424
| Levels | Levels.1 |
|---|---|
| Previous Daily High | 1.3380 |
| Previous Daily Low | 1.3325 |
| Previous Weekly High | 1.3476 |
| Previous Weekly Low | 1.3338 |
| Previous Monthly High | 1.3685 |
| Previous Monthly Low | 1.3300 |
| Daily Fibonacci 38.2% | 1.3346 |
| Daily Fibonacci 61.8% | 1.3359 |
| Daily Pivot Point S1 | 1.3314 |
| Daily Pivot Point S2 | 1.3292 |
| Daily Pivot Point S3 | 1.3259 |
| Daily Pivot Point R1 | 1.3369 |
| Daily Pivot Point R2 | 1.3402 |
| Daily Pivot Point R3 | 1.3424 |
[/s2If]
Join Our Telegram Group
")


