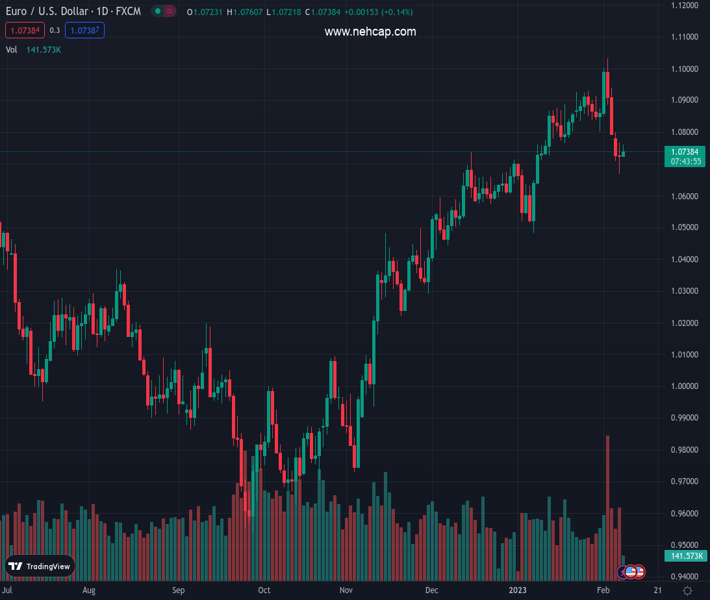
#EURUSD @ 1.07412 fails to extend the bounce past the 1.0780 level. (Pivot Orderbook analysis)
…
This is a premium post.
[s2If !current_user_can(access_s2member_level4)]Please register for PREMIUM VERSION HERE to read full post below containing analysis. In case of any error or you think you are not able to read the full post below, please email us at support#nehcap.com [lwa][/s2If] [s2If current_user_can(access_s2member_level4)]
- EUR/USD fails to extend the bounce past the 1.0780 level.
- The 3-month line near 1.0780 keeps capping the upside.
The pair currently trades last at 1.07412.
The previous day high was 1.0767 while the previous day low was 1.0669. The daily 38.2% Fib levels comes at 1.0706, expected to provide support. Similarly, the daily 61.8% fib level is at 1.0729, expected to provide support.
EUR/USD bounces off Tuesday’s lows near 1.0670, although the bullish attempt runs out of steam near 1.0760.
As long as the 3-month resistance line near 1.0780 continues to cap the upside, the pair is expected to remain under pressure and thus another move to the February low near 1.0670 should not be discarded just yet.
In the longer run, the constructive view remains unchanged while above the 200-day SMA, today at 1.0319.
Technical Levels: Supports and Resistances
EURUSD currently trading at 1.0732 at the time of writing. Pair opened at 1.0725 and is trading with a change of 0.07 % .
| Overview | Overview.1 | |
|---|---|---|
| 0 | Today last price | 1.0732 |
| 1 | Today Daily Change | 39.0000 |
| 2 | Today Daily Change % | 0.0700 |
| 3 | Today daily open | 1.0725 |
The pair is trading below its 20 Daily moving average @ 1.0841, above its 50 Daily moving average @ 1.0693 , above its 100 Daily moving average @ 1.0335 and above its 200 Daily moving average @ 1.0321
| Trends | Trends.1 | |
|---|---|---|
| 0 | Daily SMA20 | 1.0841 |
| 1 | Daily SMA50 | 1.0693 |
| 2 | Daily SMA100 | 1.0335 |
| 3 | Daily SMA200 | 1.0321 |
The previous day high was 1.0767 while the previous day low was 1.0669. The daily 38.2% Fib levels comes at 1.0706, expected to provide support. Similarly, the daily 61.8% fib level is at 1.0729, expected to provide support.
Note the levels of interest below:
- Pivot support is noted at 1.0674, 1.0623, 1.0577
- Pivot resistance is noted at 1.0771, 1.0818, 1.0869
| Levels | Levels.1 |
|---|---|
| Previous Daily High | 1.0767 |
| Previous Daily Low | 1.0669 |
| Previous Weekly High | 1.1033 |
| Previous Weekly Low | 1.0793 |
| Previous Monthly High | 1.0930 |
| Previous Monthly Low | 1.0483 |
| Daily Fibonacci 38.2% | 1.0706 |
| Daily Fibonacci 61.8% | 1.0729 |
| Daily Pivot Point S1 | 1.0674 |
| Daily Pivot Point S2 | 1.0623 |
| Daily Pivot Point S3 | 1.0577 |
| Daily Pivot Point R1 | 1.0771 |
| Daily Pivot Point R2 | 1.0818 |
| Daily Pivot Point R3 | 1.0869 |
[/s2If]
Join Our Telegram Group
")


