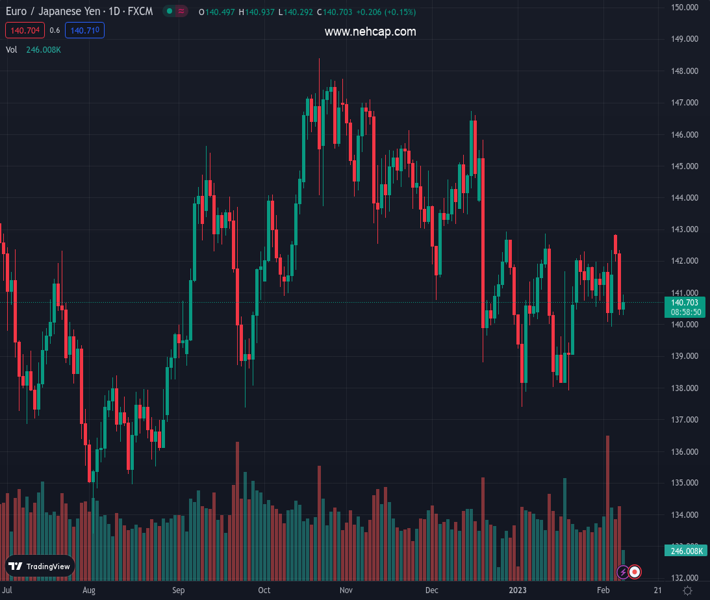
#EURJPY @ 140.696 alternates gains with losses around 140.50 midweek. (Pivot Orderbook analysis)
…
This is a premium post.
[s2If !current_user_can(access_s2member_level4)]Please register for PREMIUM VERSION HERE to read full post below containing analysis. In case of any error or you think you are not able to read the full post below, please email us at support#nehcap.com [lwa][/s2If] [s2If current_user_can(access_s2member_level4)]
- EUR/JPY alternates gains with losses around 140.50 midweek.
- The 143.00 region remains a tough near-term resistance zone.
The pair currently trades last at 140.696.
The previous day high was 142.44 while the previous day low was 140.29. The daily 38.2% Fib levels comes at 141.11, expected to provide resistance. Similarly, the daily 61.8% fib level is at 141.62, expected to provide resistance.
EUR/JPY navigates within a narrow range in the mid-140.00s following Tuesday’s sharp sell-off.
While the cross is expected to maintain the side-lined theme in the short term, the 143.00 area remains a solid barrier for bulls. This key resistance zone also appears reinforced by the 100-day SMA, today at 142.89
If the cross breaches the 200-day SMA at 141.00 on a sustainable fashion, the outlook is expected to shift to bearish.
Technical Levels: Supports and Resistances
EURJPY currently trading at 140.55 at the time of writing. Pair opened at 140.6 and is trading with a change of -0.04 % .
| Overview | Overview.1 | |
|---|---|---|
| 0 | Today last price | 140.55 |
| 1 | Today Daily Change | 64.00 |
| 2 | Today Daily Change % | -0.04 |
| 3 | Today daily open | 140.60 |
The pair remains strongly bearish on the daily time frame. It trades below the 20 SMA @ 140.76, 50 SMA 141.68, 100 SMA @ 142.94 and 200 SMA @ 141.02.
| Trends | Trends.1 | |
|---|---|---|
| 0 | Daily SMA20 | 140.76 |
| 1 | Daily SMA50 | 141.68 |
| 2 | Daily SMA100 | 142.94 |
| 3 | Daily SMA200 | 141.02 |
The previous day high was 142.44 while the previous day low was 140.29. The daily 38.2% Fib levels comes at 141.11, expected to provide resistance. Similarly, the daily 61.8% fib level is at 141.62, expected to provide resistance.
Note the levels of interest below:
- Pivot support is noted at 139.78, 138.96, 137.62
- Pivot resistance is noted at 141.93, 143.26, 144.08
| Levels | Levels.1 |
|---|---|
| Previous Daily High | 142.44 |
| Previous Daily Low | 140.29 |
| Previous Weekly High | 142.34 |
| Previous Weekly Low | 139.93 |
| Previous Monthly High | 142.86 |
| Previous Monthly Low | 137.39 |
| Daily Fibonacci 38.2% | 141.11 |
| Daily Fibonacci 61.8% | 141.62 |
| Daily Pivot Point S1 | 139.78 |
| Daily Pivot Point S2 | 138.96 |
| Daily Pivot Point S3 | 137.62 |
| Daily Pivot Point R1 | 141.93 |
| Daily Pivot Point R2 | 143.26 |
| Daily Pivot Point R3 | 144.08 |
[/s2If]
Join Our Telegram Group
")


