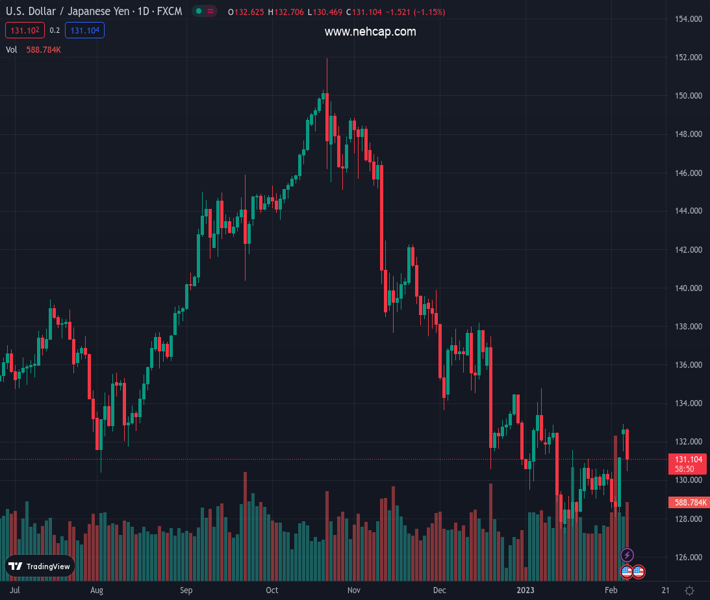
#USDJPY @ 131.052 The Japanese Yen gained traction, as shown by the sliding 1% toward 131.10s. (Pivot Orderbook analysis)
…
This is a premium post.
[s2If !current_user_can(access_s2member_level4)]Please register for PREMIUM VERSION HERE to read full post below containing analysis. In case of any error or you think you are not able to read the full post below, please email us at support#nehcap.com [lwa][/s2If] [s2If current_user_can(access_s2member_level4)]
- The Japanese Yen gained traction, as shown by the USD/JPY sliding 1% toward 131.10s.
- USD/JPY Price Analysis: On a pullback in the near-term, as bull’s eye, the 20-DMA
The pair currently trades last at 131.052.
The previous day high was 132.91 while the previous day low was 131.18. The daily 38.2% Fib levels comes at 132.25, expected to provide resistance. Similarly, the daily 61.8% fib level is at 131.84, expected to provide resistance.
The USDJPY erased Monday’s gains and collapsed to the 131.00 area after hitting a week-high of 132.90. Intervention by Japanese authorities weakened the US Dollar (USD), giving way to a 140 pip drop. At the time of writing, the USD/JPY exchanges hand at 131.21, below its opening price by 1.08%.
From a daily chart perspective, the USD/JPY remains upward biased, even though it failed to crack Monday’s daily high and tumbled beneath the 20-day Exponential Moving Average (EMA) at 130.58. However, bulls stepped in around the latter, and the USD/JPY reclaimed the 131.00 figure, which could exacerbate a re-test of 132.00. Then, the USD/JPY next resistance would be the 50-day EMA at 132.84, ahead of the 200-day EMA at 133.85.
As an alternate scenario, the USD/JPY first support would be the 131.00 figure. Once broken, the 20-day EMA at 130.58 would be the following line of defense for USD/JPY bulls, followed by a move lower to the 130.00 psychological level.
Indicators portrayed a sideways scenario, with the Relative Strength Index (RSI), although remaining upward biased, about to turn bearish. Contrarily, the Rate of Change (RoC) suggests that buyers remain in control, albeit being outpaced by sellers on Monday.
Technical Levels: Supports and Resistances
USDJPY currently trading at 131.22 at the time of writing. Pair opened at 132.62 and is trading with a change of -1.06 % .
| Overview | Overview.1 | |
|---|---|---|
| 0 | Today last price | 131.22 |
| 1 | Today Daily Change | -1.40 |
| 2 | Today Daily Change % | -1.06 |
| 3 | Today daily open | 132.62 |
The pair is trading above its 20 Daily moving average @ 129.9, below its 50 Daily moving average @ 132.69 , below its 100 Daily moving average @ 138.68 and below its 200 Daily moving average @ 136.8
| Trends | Trends.1 | |
|---|---|---|
| 0 | Daily SMA20 | 129.90 |
| 1 | Daily SMA50 | 132.69 |
| 2 | Daily SMA100 | 138.68 |
| 3 | Daily SMA200 | 136.80 |
The previous day high was 132.91 while the previous day low was 131.18. The daily 38.2% Fib levels comes at 132.25, expected to provide resistance. Similarly, the daily 61.8% fib level is at 131.84, expected to provide resistance.
Note the levels of interest below:
- Pivot support is noted at 131.57, 130.52, 129.85
- Pivot resistance is noted at 133.29, 133.96, 135.01
| Levels | Levels.1 |
|---|---|
| Previous Daily High | 132.91 |
| Previous Daily Low | 131.18 |
| Previous Weekly High | 131.20 |
| Previous Weekly Low | 128.08 |
| Previous Monthly High | 134.78 |
| Previous Monthly Low | 127.22 |
| Daily Fibonacci 38.2% | 132.25 |
| Daily Fibonacci 61.8% | 131.84 |
| Daily Pivot Point S1 | 131.57 |
| Daily Pivot Point S2 | 130.52 |
| Daily Pivot Point S3 | 129.85 |
| Daily Pivot Point R1 | 133.29 |
| Daily Pivot Point R2 | 133.96 |
| Daily Pivot Point R3 | 135.01 |
[/s2If]
Join Our Telegram Group
")


