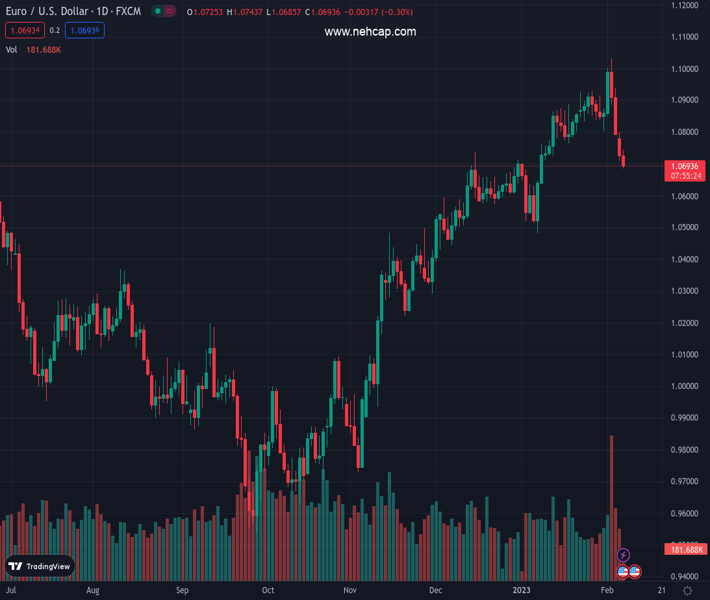
#EURUSD @ 1.06950 adds to the ongoing bearish move and drops below 1.0700. (Pivot Orderbook analysis)
…
This is a premium post.
[s2If !current_user_can(access_s2member_level4)]Please register for PREMIUM VERSION HERE to read full post below containing analysis. In case of any error or you think you are not able to read the full post below, please email us at support#nehcap.com [lwa][/s2If] [s2If current_user_can(access_s2member_level4)]
- EUR/USD adds to the ongoing bearish move and drops below 1.0700.
- Extra decline appears in the pipeline below the 1.0770 region.
The pair currently trades last at 1.06950.
The previous day high was 1.0799 while the previous day low was 1.071. The daily 38.2% Fib levels comes at 1.0744, expected to provide resistance. Similarly, the daily 61.8% fib level is at 1.0765, expected to provide resistance.
EUR/USD remains well on the defensive and drops to new lows in the sub-1.0700 zone on Tuesday.
The pair has recently broken below the 3-month support line near 1.0770, and this now allows for the downtrend to gather extra impulse in the near term. Against that, the next interim support comes at the 55-day SMA at 1.0662, while the breach of this region could open the door to a deeper retracement to the 2023 low at 1.0481 (January 6).
In the longer run, the constructive view remains unchanged while above the 200-day SMA, today at 1.0319.
Technical Levels: Supports and Resistances
EURUSD currently trading at 1.07 at the time of writing. Pair opened at 1.073 and is trading with a change of -0.28 % .
| Overview | Overview.1 | |
|---|---|---|
| 0 | Today last price | 1.070 |
| 1 | Today Daily Change | 55.000 |
| 2 | Today Daily Change % | -0.280 |
| 3 | Today daily open | 1.073 |
The pair is trading below its 20 Daily moving average @ 1.0841, above its 50 Daily moving average @ 1.0685 , above its 100 Daily moving average @ 1.0327 and above its 200 Daily moving average @ 1.032
| Trends | Trends.1 | |
|---|---|---|
| 0 | Daily SMA20 | 1.0841 |
| 1 | Daily SMA50 | 1.0685 |
| 2 | Daily SMA100 | 1.0327 |
| 3 | Daily SMA200 | 1.0320 |
The previous day high was 1.0799 while the previous day low was 1.071. The daily 38.2% Fib levels comes at 1.0744, expected to provide resistance. Similarly, the daily 61.8% fib level is at 1.0765, expected to provide resistance.
Note the levels of interest below:
- Pivot support is noted at 1.0693, 1.0657, 1.0604
- Pivot resistance is noted at 1.0782, 1.0835, 1.0872
| Levels | Levels.1 |
|---|---|
| Previous Daily High | 1.0799 |
| Previous Daily Low | 1.0710 |
| Previous Weekly High | 1.1033 |
| Previous Weekly Low | 1.0793 |
| Previous Monthly High | 1.0930 |
| Previous Monthly Low | 1.0483 |
| Daily Fibonacci 38.2% | 1.0744 |
| Daily Fibonacci 61.8% | 1.0765 |
| Daily Pivot Point S1 | 1.0693 |
| Daily Pivot Point S2 | 1.0657 |
| Daily Pivot Point S3 | 1.0604 |
| Daily Pivot Point R1 | 1.0782 |
| Daily Pivot Point R2 | 1.0835 |
| Daily Pivot Point R3 | 1.0872 |
[/s2If]
Join Our Telegram Group
")


