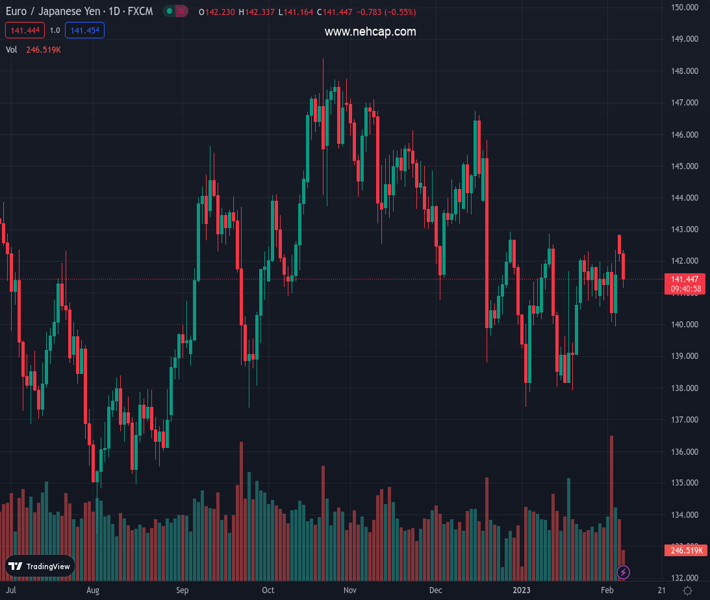
#EURJPY @ 141.450 gives away part of the recent strong rebound to the 143.00 area. (Pivot Orderbook analysis)
…
This is a premium post.
[s2If !current_user_can(access_s2member_level4)]Please register for PREMIUM VERSION HERE to read full post below containing analysis. In case of any error or you think you are not able to read the full post below, please email us at support#nehcap.com [lwa][/s2If] [s2If current_user_can(access_s2member_level4)]
- EUR/JPY gives away part of the recent strong rebound to the 143.00 area.
- Losses could gather traction on a breach of the 200-day SMA.
The pair currently trades last at 141.450.
The previous day high was 142.88 while the previous day low was 141.59. The daily 38.2% Fib levels comes at 142.39, expected to provide resistance. Similarly, the daily 61.8% fib level is at 142.08, expected to provide resistance.
EUR/JPY leaves behind two consecutive sessions with gains and comes under pressure after another failed attempt to break above the 143.00 region.
In the meantime, the 143.00 area remains a tough barrier for bulls. This key resistance zone appears reinforced by the 100-day SMA, today at 142.91
If the cross breaches the 200-day SMA at 140.99, the outlook is expected to shift to bearish.
Technical Levels: Supports and Resistances
EURJPY currently trading at 141.48 at the time of writing. Pair opened at 142.3 and is trading with a change of -0.58 % .
| Overview | Overview.1 | |
|---|---|---|
| 0 | Today last price | 141.48 |
| 1 | Today Daily Change | 117.00 |
| 2 | Today Daily Change % | -0.58 |
| 3 | Today daily open | 142.30 |
The pair is trading above its 20 Daily moving average @ 140.83, below its 50 Daily moving average @ 141.73 , below its 100 Daily moving average @ 142.97 and above its 200 Daily moving average @ 141.01
| Trends | Trends.1 | |
|---|---|---|
| 0 | Daily SMA20 | 140.83 |
| 1 | Daily SMA50 | 141.73 |
| 2 | Daily SMA100 | 142.97 |
| 3 | Daily SMA200 | 141.01 |
The previous day high was 142.88 while the previous day low was 141.59. The daily 38.2% Fib levels comes at 142.39, expected to provide resistance. Similarly, the daily 61.8% fib level is at 142.08, expected to provide resistance.
Note the levels of interest below:
- Pivot support is noted at 141.63, 140.97, 140.35
- Pivot resistance is noted at 142.92, 143.54, 144.2
| Levels | Levels.1 |
|---|---|
| Previous Daily High | 142.88 |
| Previous Daily Low | 141.59 |
| Previous Weekly High | 142.34 |
| Previous Weekly Low | 139.93 |
| Previous Monthly High | 142.86 |
| Previous Monthly Low | 137.39 |
| Daily Fibonacci 38.2% | 142.39 |
| Daily Fibonacci 61.8% | 142.08 |
| Daily Pivot Point S1 | 141.63 |
| Daily Pivot Point S2 | 140.97 |
| Daily Pivot Point S3 | 140.35 |
| Daily Pivot Point R1 | 142.92 |
| Daily Pivot Point R2 | 143.54 |
| Daily Pivot Point R3 | 144.20 |
[/s2If]
Join Our Telegram Group
")


