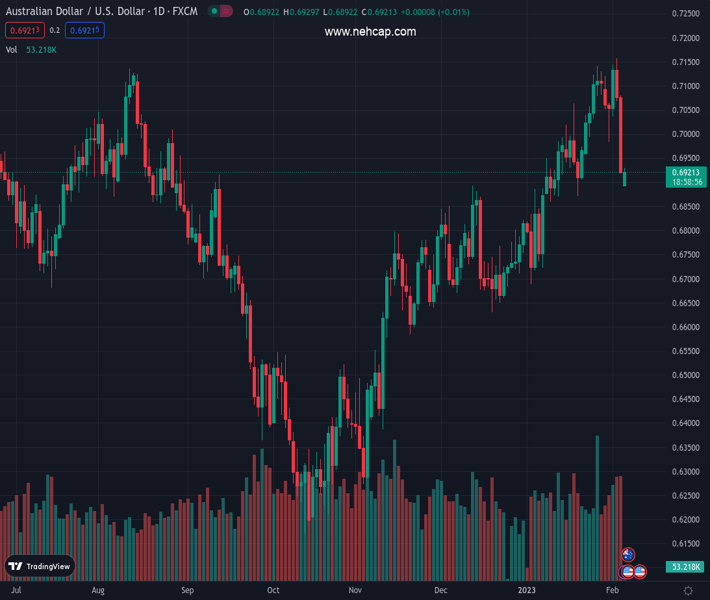
#AUDUSD @ 0.69215 fades bounces off 12-day low, mildly offered by the press time. (Pivot Orderbook analysis)
…
This is a premium post.
[s2If !current_user_can(access_s2member_level4)]Please register for PREMIUM VERSION HERE to read full post below containing analysis. In case of any error or you think you are not able to read the full post below, please email us at support#nehcap.com [lwa][/s2If] [s2If current_user_can(access_s2member_level4)]
- AUD/USD fades bounces off 12-day low, mildly offered by the press time.
- Aussie data came in mixed as Retail Sales shrank less than expected, inflation signals improved.
- US shot China’s balloon terming it a spy, putting Sino-American ties again in danger.
- Risk catalysts will be crucial for immediate directions.
The pair currently trades last at 0.69215.
The previous day high was 0.7088 while the previous day low was 0.6919. The daily 38.2% Fib levels comes at 0.6983, expected to provide resistance. Similarly, the daily 61.8% fib level is at 0.7023, expected to provide resistance.
AUD/USD retreats from intraday high, fading the initial reaction to the mixed Aussie data amid risk-off mood amid early Monday. In doing so, the risk-barometer pair prints a three-day downtrend as sellers attack the 0.6900 round figure after refreshing the two-week low.
Earlier in the day, Australia’s fourth quarter (Q4) Retail Sales dropped 0.2% QoQ versus -0.6% expected and prior increase of 0.2%. Additionally, TD Securities Inflation for the nation rose to 0.9% MoM from 0.2% prior, as well as to 6.4% YoY versus 5.9% previous readouts, during January.
Talking about the risk, the weekend headlines suggesting the US military fighter jet shot down a suspected Chinese spy balloon off the coast of South Carolina weighed on the sentiment as US Secretary of State Antony Blinked called off his previously planned visit to Beijing following the event. In a reaction to the event, China President Xi Jinping termed this as an ‘obvious overreaction’.
Elsewhere, the dovish Fed actions couldn’t keep the US Dollar bears hopeful following the strong US jobs report and activity data. That said, the US Bureau of Labor Statistics (BLS) surprised markets by revealing that the Nonfarm Payrolls (NFP) rose by 517K in January, versus 185K expected and 260K (upwardly revised) prior. It’s worth noting that the Unemployment Rate also dropped to 3.4% from 3.5% prior and 3.6% expected but the Average Hourly Earnings eased during the stated month. Furthermore, the rebound in the US ISM Services PMI from 49.2 to 55.2, versus 50.4 expected, also underpinned the rebound in the United States Treasury bond yields and the US Dollar.
That said, S&P 500 Futures extend the previous day’s pullback from the highest levels since August, down 0.30% intraday near 4,140 by the press time. On the same line, the US 10-year Treasury bond yields remain firmer for the third consecutive day, to 3.56% by the press time, following the biggest weekly jump since late September 2022.
Looking forward, headlines surrounding China and the concerns over the Reserve Bank of Australia’s (RBA) next move could entertain AUD/USD pair traders ahead of Tuesday’s speech from Federal Reserve (Fed) Chairman Jerome Powel. Following that, Friday’s US UoM Consumer Sentiment Index for February, as well as the University of Michigan’s 5-year Consumer Inflation expectations, will be important for the pair traders to watch.
It should be noted that the market concerns favor a hawkish move from the RBA amid upbeat inflation data but a less than 0.25% rate hike could quickly drag the AUD/USD pair.
A sustained downside break of a three-month-old ascending trend line, around 0.6930 by the press time, directs AUD/USD further toward the south.
Technical Levels: Supports and Resistances
AUDUSD currently trading at 0.6915 at the time of writing. Pair opened at 0.6923 and is trading with a change of -0.12% % .
| Overview | Overview.1 | |
|---|---|---|
| 0 | Today last price | 0.6915 |
| 1 | Today Daily Change | -0.0008 |
| 2 | Today Daily Change % | -0.12% |
| 3 | Today daily open | 0.6923 |
The pair is trading below its 20 Daily moving average @ 0.7003, above its 50 Daily moving average @ 0.6851 , above its 100 Daily moving average @ 0.667 and above its 200 Daily moving average @ 0.6811
| Trends | Trends.1 | |
|---|---|---|
| 0 | Daily SMA20 | 0.7003 |
| 1 | Daily SMA50 | 0.6851 |
| 2 | Daily SMA100 | 0.6670 |
| 3 | Daily SMA200 | 0.6811 |
The previous day high was 0.7088 while the previous day low was 0.6919. The daily 38.2% Fib levels comes at 0.6983, expected to provide resistance. Similarly, the daily 61.8% fib level is at 0.7023, expected to provide resistance.
Note the levels of interest below:
- Pivot support is noted at 0.6865, 0.6808, 0.6697
- Pivot resistance is noted at 0.7034, 0.7145, 0.7202
| Levels | Levels.1 |
|---|---|
| Previous Daily High | 0.7088 |
| Previous Daily Low | 0.6919 |
| Previous Weekly High | 0.7158 |
| Previous Weekly Low | 0.6919 |
| Previous Monthly High | 0.7143 |
| Previous Monthly Low | 0.6688 |
| Daily Fibonacci 38.2% | 0.6983 |
| Daily Fibonacci 61.8% | 0.7023 |
| Daily Pivot Point S1 | 0.6865 |
| Daily Pivot Point S2 | 0.6808 |
| Daily Pivot Point S3 | 0.6697 |
| Daily Pivot Point R1 | 0.7034 |
| Daily Pivot Point R2 | 0.7145 |
| Daily Pivot Point R3 | 0.7202 |
[/s2If]
Join Our Telegram Group
")


