#USDCHF @ 0.92600 The US Dollar strengthens across the FX space, a tailwind for the . (Pivot Orderbook analysis)
…
This is a premium post.
[s2If !current_user_can(access_s2member_level4)]Please register for PREMIUM VERSION HERE to read full post below containing analysis. In case of any error or you think you are not able to read the full post below, please email us at support#nehcap.com [lwa][/s2If] [s2If current_user_can(access_s2member_level4)]
- The US Dollar strengthens across the FX space, a tailwind for the USD/CHF.
- USD/CHF Price Analysis: Shifted to neutral biased once buyers hurdle the 20-DMA.
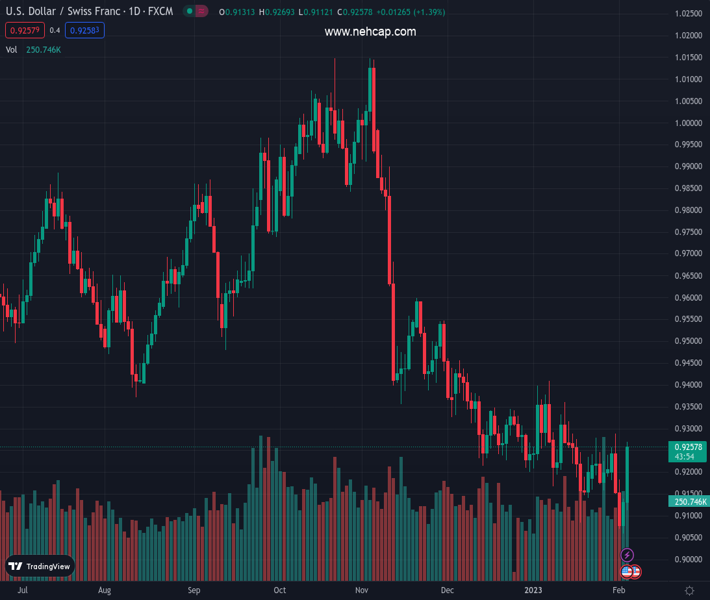
The pair currently trades last at 0.92600.
The previous day high was 0.914 while the previous day low was 0.9059. The daily 38.2% Fib levels comes at 0.9109, expected to provide support. Similarly, the daily 61.8% fib level is at 0.909, expected to provide support.
The USD/CHF is surging sharply during Friday’s North American session, as Wall Street is set to finish the last trading day of the week with losses. Therefore, the USD/CHF is trading at 0.9260, above its opening price by 1.42%.
On Friday, the USD/CHF rally broke two downslope resistance trendlines, which would pave the way for further losses. In addition, the 20-day Exponential Moving Average (EMA) at 0.9210 was reclaimed during the uptrend, exposing crucial resistance levels, which, once cleared it, could pave the way for further gains.
The USD/CHF first resistance will be the January 31 daily high at 0.9288. A breach of the latter and the 0.9307, the 50-day EMA is up for grabs., followed by January’s 12 high at 0.9360.
On the flip side, the USD/CHF first support would be the 20-day EMA at 0.9210. Bears reclaiming the latter would exacerbate a fall below 0.9200, followed by the February 3 daily low at 0.9112.
Technical Levels: Supports and Resistances
USDCHF currently trading at 0.9263 at the time of writing. Pair opened at 0.9135 and is trading with a change of 1.4 % .
| Overview | Overview.1 | |
|---|---|---|
| 0 | Today last price | 0.9263 |
| 1 | Today Daily Change | 0.0128 |
| 2 | Today Daily Change % | 1.4000 |
| 3 | Today daily open | 0.9135 |
The pair is trading above its 20 Daily moving average @ 0.9213, below its 50 Daily moving average @ 0.9292 , below its 100 Daily moving average @ 0.9552 and below its 200 Daily moving average @ 0.9622
| Trends | Trends.1 | |
|---|---|---|
| 0 | Daily SMA20 | 0.9213 |
| 1 | Daily SMA50 | 0.9292 |
| 2 | Daily SMA100 | 0.9552 |
| 3 | Daily SMA200 | 0.9622 |
The previous day high was 0.914 while the previous day low was 0.9059. The daily 38.2% Fib levels comes at 0.9109, expected to provide support. Similarly, the daily 61.8% fib level is at 0.909, expected to provide support.
Note the levels of interest below:
- Pivot support is noted at 0.9083, 0.9031, 0.9003
- Pivot resistance is noted at 0.9163, 0.9191, 0.9243
| Levels | Levels.1 |
|---|---|
| Previous Daily High | 0.9140 |
| Previous Daily Low | 0.9059 |
| Previous Weekly High | 0.9280 |
| Previous Weekly Low | 0.9158 |
| Previous Monthly High | 0.9410 |
| Previous Monthly Low | 0.9085 |
| Daily Fibonacci 38.2% | 0.9109 |
| Daily Fibonacci 61.8% | 0.9090 |
| Daily Pivot Point S1 | 0.9083 |
| Daily Pivot Point S2 | 0.9031 |
| Daily Pivot Point S3 | 0.9003 |
| Daily Pivot Point R1 | 0.9163 |
| Daily Pivot Point R2 | 0.9191 |
| Daily Pivot Point R3 | 0.9243 |
[/s2If]
Join Our Telegram Group
")


