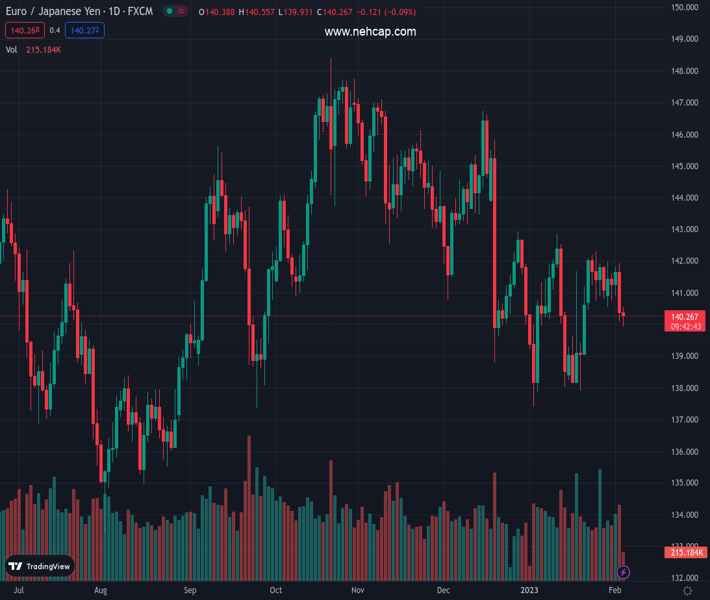
#EURJPY @ 140.278 trades with modest losses and adds to Thursday’s strong drop. (Pivot Orderbook analysis)
…
This is a premium post.
[s2If !current_user_can(access_s2member_level4)]Please register for PREMIUM VERSION HERE to read full post below containing analysis. In case of any error or you think you are not able to read the full post below, please email us at support#nehcap.com [lwa][/s2If] [s2If current_user_can(access_s2member_level4)]
- EUR/JPY trades with modest losses and adds to Thursday’s strong drop.
- The cross broke below the 200-day SMA, exposing further weakness.
The pair currently trades last at 140.278.
The previous day high was 141.94 while the previous day low was 140.08. The daily 38.2% Fib levels comes at 140.79, expected to provide resistance. Similarly, the daily 61.8% fib level is at 141.23, expected to provide resistance.
EUR/JPY remains under pressure and briefly revisited the key 140.00 neighbourhood at the end of the week.
The cross appears to have broken below the multi-session consolidative phase as well as the 200-day SMA, today at 140.93.
In doing so, further decline now appears in store in the very near term and with the immediate target at the 138.00 region.
Technical Levels: Supports and Resistances
EURJPY currently trading at 140.33 at the time of writing. Pair opened at 140.52 and is trading with a change of -0.14 % .
| Overview | Overview.1 | |
|---|---|---|
| 0 | Today last price | 140.33 |
| 1 | Today Daily Change | 62.00 |
| 2 | Today Daily Change % | -0.14 |
| 3 | Today daily open | 140.52 |
The pair remains strongly bearish on the daily time frame. It trades below the 20 SMA @ 140.74, 50 SMA 141.82, 100 SMA @ 143.0 and 200 SMA @ 140.95.
| Trends | Trends.1 | |
|---|---|---|
| 0 | Daily SMA20 | 140.74 |
| 1 | Daily SMA50 | 141.82 |
| 2 | Daily SMA100 | 143.00 |
| 3 | Daily SMA200 | 140.95 |
The previous day high was 141.94 while the previous day low was 140.08. The daily 38.2% Fib levels comes at 140.79, expected to provide resistance. Similarly, the daily 61.8% fib level is at 141.23, expected to provide resistance.
Note the levels of interest below:
- Pivot support is noted at 139.76, 138.99, 137.9
- Pivot resistance is noted at 141.61, 142.7, 143.46
| Levels | Levels.1 |
|---|---|
| Previous Daily High | 141.94 |
| Previous Daily Low | 140.08 |
| Previous Weekly High | 142.30 |
| Previous Weekly Low | 140.47 |
| Previous Monthly High | 142.86 |
| Previous Monthly Low | 137.39 |
| Daily Fibonacci 38.2% | 140.79 |
| Daily Fibonacci 61.8% | 141.23 |
| Daily Pivot Point S1 | 139.76 |
| Daily Pivot Point S2 | 138.99 |
| Daily Pivot Point S3 | 137.90 |
| Daily Pivot Point R1 | 141.61 |
| Daily Pivot Point R2 | 142.70 |
| Daily Pivot Point R3 | 143.46 |
[/s2If]
Join Our Telegram Group
")


