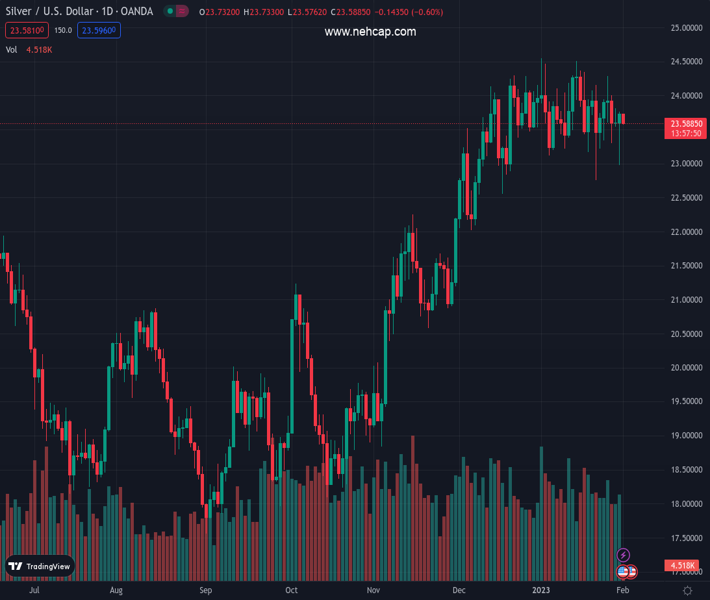
#XAGUSD @ 23.583 Silver stalls the overnight recovery move near the $23.70-80 support breakpoint. (Pivot Orderbook analysis)
…
This is a premium post.
[s2If !current_user_can(access_s2member_level4)]Please register for PREMIUM VERSION HERE to read full post below containing analysis. In case of any error or you think you are not able to read the full post below, please email us at support#nehcap.com [lwa][/s2If] [s2If current_user_can(access_s2member_level4)]
- Silver stalls the overnight recovery move near the $23.70-80 support breakpoint.
- The technical setup warrants some caution before placing fresh directional bets.
- A break below the $23.00 mark is needed to support prospects for deeper losses.
The pair currently trades last at 23.583.
The previous day high was 23.77 while the previous day low was 22.97. The daily 38.2% Fib levels comes at 23.46, expected to provide support. Similarly, the daily 61.8% fib level is at 23.28, expected to provide support.
Silver struggles to capitalize on the previous day’s goodish rebound from sub-$23.00 levels, or over a one-week low and oscillates in a narrow band through the early European session on Wednesday. The white metal is currently placed just above the mid-$23.00s, consolidating around the 200-hour SMA.
From a technical perspective, the XAG/USD remains capped near the $23.70-$23.80 support breakpoint, marking the lower end of a short-term ascending trend channel. The said area might act as a pivotal point for traders, which if cleared decisively should pave the way for some meaningful upside.
The XAG/USD might then aim to surpass the $24.00 round figure and retest the multi-month top, around the $24.50-$24.55 zone touched in January. The positive momentum could get extended further and allow bullish traders to reclaim the $25.00 psychological mark for the first time since April 2022.
That said, neutral technical indicators on daily/4-hour charts warrant some caution before positioning for a further near-term appreciating move. Moreover, the recent rangebound price action witnessed since December 21 points to indecision among traders over the next leg of a directional move for the XAG/USD.
In the meantime, the $23.30 area might now protect the immediate downside ahead of the overnight low, around the $23.00-$22.95 region. This is closely followed by support near the $22.75 region, which if broken decisively will make the XAG/USD vulnerable to fall towards the $22.20-$22.15 support.
Technical Levels: Supports and Resistances
XAGUSD currently trading at 23.6 at the time of writing. Pair opened at 23.74 and is trading with a change of -0.59 % .
| Overview | Overview.1 | |
|---|---|---|
| 0 | Today last price | 23.60 |
| 1 | Today Daily Change | -0.14 |
| 2 | Today Daily Change % | -0.59 |
| 3 | Today daily open | 23.74 |
The pair is trading below its 20 Daily moving average @ 23.74, above its 50 Daily moving average @ 23.32 , above its 100 Daily moving average @ 21.58 and above its 200 Daily moving average @ 21.01
| Trends | Trends.1 | |
|---|---|---|
| 0 | Daily SMA20 | 23.74 |
| 1 | Daily SMA50 | 23.32 |
| 2 | Daily SMA100 | 21.58 |
| 3 | Daily SMA200 | 21.01 |
The previous day high was 23.77 while the previous day low was 22.97. The daily 38.2% Fib levels comes at 23.46, expected to provide support. Similarly, the daily 61.8% fib level is at 23.28, expected to provide support.
Note the levels of interest below:
- Pivot support is noted at 23.22, 22.7, 22.42
- Pivot resistance is noted at 24.01, 24.29, 24.81
| Levels | Levels.1 |
|---|---|
| Previous Daily High | 23.77 |
| Previous Daily Low | 22.97 |
| Previous Weekly High | 24.30 |
| Previous Weekly Low | 22.76 |
| Previous Monthly High | 24.55 |
| Previous Monthly Low | 22.76 |
| Daily Fibonacci 38.2% | 23.46 |
| Daily Fibonacci 61.8% | 23.28 |
| Daily Pivot Point S1 | 23.22 |
| Daily Pivot Point S2 | 22.70 |
| Daily Pivot Point S3 | 22.42 |
| Daily Pivot Point R1 | 24.01 |
| Daily Pivot Point R2 | 24.29 |
| Daily Pivot Point R3 | 24.81 |
[/s2If]
Join Our Telegram Group


