#EURUSD @ 1.08688 fades bounce off 21-day EMA inside rising wedge bearish chart pattern., @nehcap view: Downside expected (Pivot Orderbook analysis)
…
This is a premium post.
[s2If !current_user_can(access_s2member_level4)]Please register for PREMIUM VERSION HERE to read full post below containing analysis. In case of any error or you think you are not able to read the full post below, please email us at support#nehcap.com [lwa][/s2If] [s2If current_user_can(access_s2member_level4)]
- EUR/USD fades bounce off 21-day EMA inside rising wedge bearish chart pattern.
- RSI’s retreat from overbought territory, bearish MACD signals also favor downside bias.
- 200-day EMA acts as additional key support while buyers need validation from 1.0965 for a free move.
- Dovish bias on Fed signals room for extreme reaction to surprise outcome.
The pair currently trades last at 1.08688.
The previous day high was 1.0875 while the previous day low was 1.0802. The daily 38.2% Fib levels comes at 1.0847, expected to provide support. Similarly, the daily 61.8% fib level is at 1.083, expected to provide support.
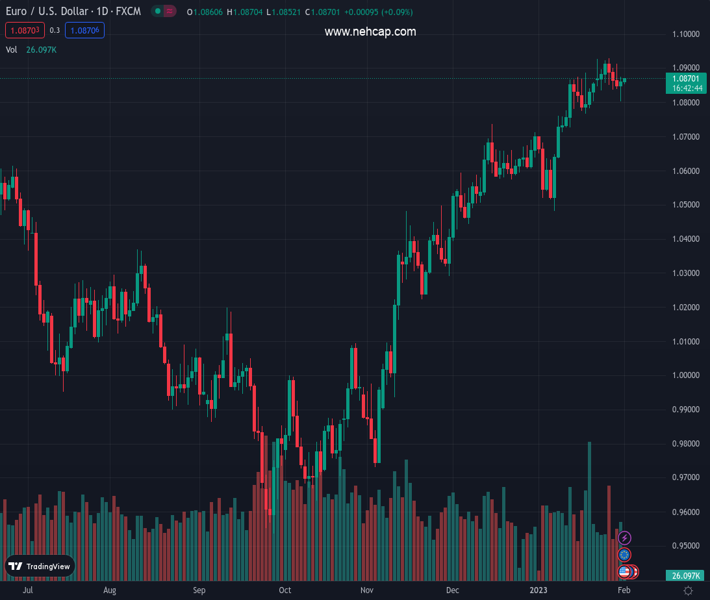
EUR/USD buyers seem running out of steam as the quote seesaws near 1.0860-70 heading into Wednesday’s European session.
That said, the major currency pair bounced off the 21-day Exponential Moving Average (EMA) the previous day but stays inside a three-month-old rising wedge bearish chart pattern as traders await the Federal Open Market Committee (FOMC) monetary policy meeting results.
Also read: EUR/USD slides to 1.0850 as German/US data intensifies ECB vs. Fed battle
It’s worth noting that the RSI (14) pullback from overbought territory joins the bearish MACD signals to challenge the EUR/USD bulls.
Also acting as an upside hurdle is the pair’s multiple failures to cross the 1.0930.
Even if the quote rises past 1.0930, the stated wedge’s top line surrounding 1.0965 could challenge the EUR/USD bulls before directing them to cross the 1.1000 psychological magnet.
On the flip side, the 21-day EMA level of 1.0800 restricts immediate EUR/USD moves ahead of highlighting the stated wedge’s lower line, close to 1.0775 at the latest.
Should the EUR/USD bears manage to conquer the 1.0775 key support, the odds of witnessing a slump toward the late 2022 lows can’t be ruled out. However, the 200-day EMA level near 1.0500 may act as an intermediate halt during the likely slump.
Trend: Downside expected
Technical Levels: Supports and Resistances
EURUSD currently trading at 1.0866 at the time of writing. Pair opened at 1.0872 and is trading with a change of -0.06% % .
| Overview | Overview.1 | |
|---|---|---|
| 0 | Today last price | 1.0866 |
| 1 | Today Daily Change | -0.0006 |
| 2 | Today Daily Change % | -0.06% |
| 3 | Today daily open | 1.0872 |
The pair remains strongly bullish on the daily timeframe. It trades above its 20 SMA @ 1.0795, 50 SMA 1.0647, 100 SMA @ 1.0293 and 200 SMA @ 1.0314.
| Trends | Trends.1 | |
|---|---|---|
| 0 | Daily SMA20 | 1.0795 |
| 1 | Daily SMA50 | 1.0647 |
| 2 | Daily SMA100 | 1.0293 |
| 3 | Daily SMA200 | 1.0314 |
The previous day high was 1.0875 while the previous day low was 1.0802. The daily 38.2% Fib levels comes at 1.0847, expected to provide support. Similarly, the daily 61.8% fib level is at 1.083, expected to provide support.
Note the levels of interest below:
- Pivot support is noted at 1.0824, 1.0777, 1.0752
- Pivot resistance is noted at 1.0897, 1.0923, 1.097
| Levels | Levels.1 |
|---|---|
| Previous Daily High | 1.0875 |
| Previous Daily Low | 1.0802 |
| Previous Weekly High | 1.0930 |
| Previous Weekly Low | 1.0835 |
| Previous Monthly High | 1.0930 |
| Previous Monthly Low | 1.0483 |
| Daily Fibonacci 38.2% | 1.0847 |
| Daily Fibonacci 61.8% | 1.0830 |
| Daily Pivot Point S1 | 1.0824 |
| Daily Pivot Point S2 | 1.0777 |
| Daily Pivot Point S3 | 1.0752 |
| Daily Pivot Point R1 | 1.0897 |
| Daily Pivot Point R2 | 1.0923 |
| Daily Pivot Point R3 | 1.0970 |
[/s2If]
Join Our Telegram Group


