#GBPJPY @ 160.054 holds lower ground near 100-SMA support, down for the second consecutive day., @nehcap view: Further downside expected (Pivot Orderbook analysis)
…
This is a premium post.
[s2If !current_user_can(access_s2member_level4)]Please register for PREMIUM VERSION HERE to read full post below containing analysis. In case of any error or you think you are not able to read the full post below, please email us at support#nehcap.com [lwa][/s2If] [s2If current_user_can(access_s2member_level4)]
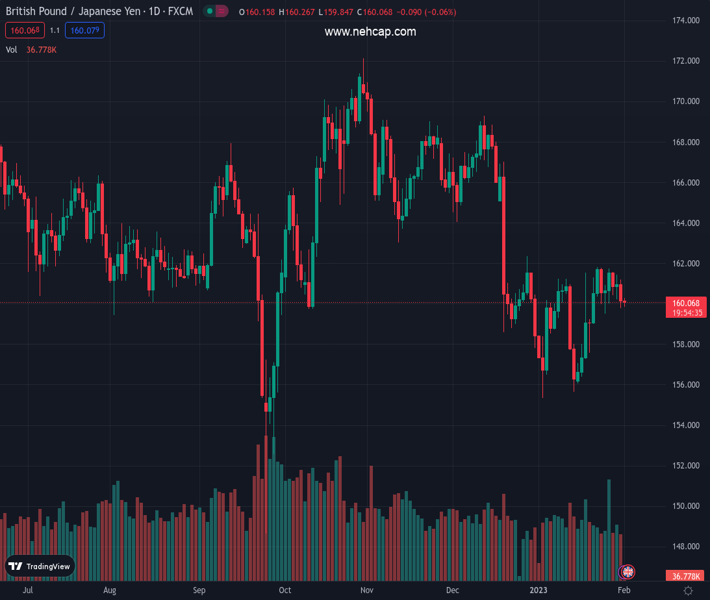
- GBP/JPY holds lower ground near 100-SMA support, down for the second consecutive day.
- Downbeat MACD signals, RSI (14) add strength to the bearish bias.
- Five-week-old descending resistance line holds the key to buyer’s conviction.
The pair currently trades last at 160.054.
The previous day high was 161.2 while the previous day low was 159.77. The daily 38.2% Fib levels comes at 160.32, expected to provide resistance. Similarly, the daily 61.8% fib level is at 160.65, expected to provide resistance.
GBP/JPY fades the late Tuesday’s corrective bounce off the 100-bar Simple Moving Average (SMA) as it prints mild losses near the 160.00 psychological magnet during early Wednesday. In doing so, the cross-currency pair keeps the previous week’s retreat from a one-month high.
Not only the failure to defend the bounce off 100-SMA but bearish MACD signals and downbeat RSI (14), not oversold, also keeps GBP/JPY bears hopeful.
However, a clear downside break of the stated SMA level surrounding 159.70 becomes necessary for the GBP/JPY bears.
Following that, the January 19 swing low near 157.60 could act as a buffer during the fall targeting the previous monthly low of 155.36. It should be noted that May 2022 low near 155.60 also challenges the short-term GBP/JPY bears.
Meanwhile, recovery moves may aim for the latest peak surrounding 161.45 before approaching a downward-sloping resistance line from late December 2022, close to 161.65 at the latest.
In a case where the quote rises past 161.65, the 50% Fibonacci retracement of GBP/JPY downbeat between late 2022 and early January 2023, around 162.30, could act as the last defense of the bears.
To sum up, GBP/JPY is likely to remain bearish even if the 100-SMA challenges the immediate downside.
Trend: Further downside expected
Technical Levels: Supports and Resistances
GBPJPY currently trading at 159.98 at the time of writing. Pair opened at 160.44 and is trading with a change of -0.29% % .
| Overview | Overview.1 | |
|---|---|---|
| 0 | Today last price | 159.98 |
| 1 | Today Daily Change | -0.46 |
| 2 | Today Daily Change % | -0.29% |
| 3 | Today daily open | 160.44 |
The pair is trading above its 20 Daily moving average @ 159.76, below its 50 Daily moving average @ 162.47 , below its 100 Daily moving average @ 163.73 and below its 200 Daily moving average @ 163.37
| Trends | Trends.1 | |
|---|---|---|
| 0 | Daily SMA20 | 159.76 |
| 1 | Daily SMA50 | 162.47 |
| 2 | Daily SMA100 | 163.73 |
| 3 | Daily SMA200 | 163.37 |
The previous day high was 161.2 while the previous day low was 159.77. The daily 38.2% Fib levels comes at 160.32, expected to provide resistance. Similarly, the daily 61.8% fib level is at 160.65, expected to provide resistance.
Note the levels of interest below:
- Pivot support is noted at 159.73, 159.03, 158.3
- Pivot resistance is noted at 161.17, 161.9, 162.6
| Levels | Levels.1 |
|---|---|
| Previous Daily High | 161.20 |
| Previous Daily Low | 159.77 |
| Previous Weekly High | 161.85 |
| Previous Weekly Low | 159.51 |
| Previous Monthly High | 161.85 |
| Previous Monthly Low | 155.36 |
| Daily Fibonacci 38.2% | 160.32 |
| Daily Fibonacci 61.8% | 160.65 |
| Daily Pivot Point S1 | 159.73 |
| Daily Pivot Point S2 | 159.03 |
| Daily Pivot Point S3 | 158.30 |
| Daily Pivot Point R1 | 161.17 |
| Daily Pivot Point R2 | 161.90 |
| Daily Pivot Point R3 | 162.60 |
[/s2If]
Join Our Telegram Group


