The Nasdaq 100, the S&P 500, and the Dow Jones registered losses between 0.77% and 2% due to a risk-off impulse that bolstered the US Dollar. (Pivot Orderbook analysis)
…
This is a premium post.
[s2If !current_user_can(access_s2member_level4)]Please register for PREMIUM VERSION HERE to read full post below containing analysis. In case of any error or you think you are not able to read the full post below, please email us at support#nehcap.com [lwa][/s2If] [s2If current_user_can(access_s2member_level4)]
- The Nasdaq 100, the S&P 500, and the Dow Jones registered losses between 0.77% and 2% due to a risk-off impulse that bolstered the US Dollar.
- Last week’s US economic data supported some Fed officials’ calls for lifting rates by 25 bps on Wednesday.
- A busy US economic calendar will feature Fed’s decision, PMIs, and the Nonfarm Payrolls report.
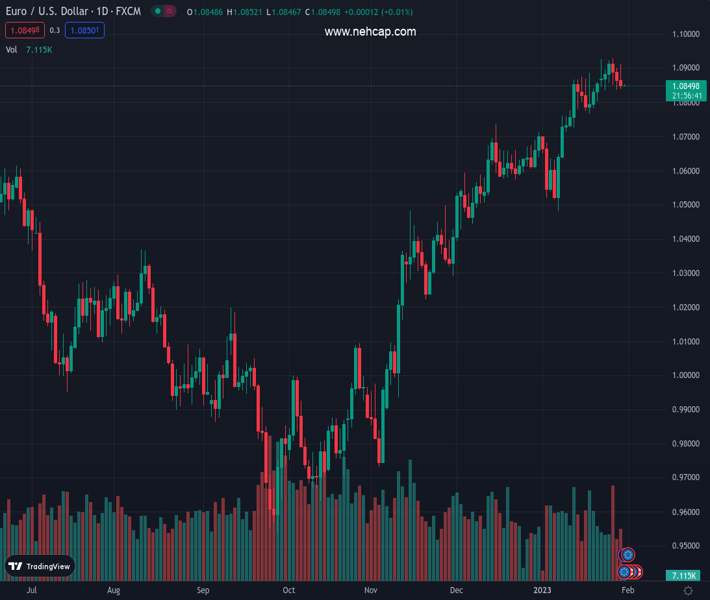
The pair currently trades last at 102.26.
The previous day high was 102.19 while the previous day low was 101.68. The daily 38.2% Fib levels comes at 102.0, expected to provide support. Similarly, the daily 61.8% fib level is at 101.88, expected to provide support.
The US Dollar Index (DXY), a measure of the greenback’s value against a basket of six currencies, continues to recover and prints gains for three straight days, finishing Monday’s session with gains of 0.30% amidst risk aversion. At the time of writing, the DXY exchanges hand at 102.224.
Wall Street finished with hefty losses, led by the Nasdaq 100, tumbling almost 2%. The S&P 500 and the Dow Jones slashed 1.30% and 0.77% of their value as traders prepared for the US Federal Reserve Open Market Committee (FOMC) decision on Wednesday. Hence, a busy US economic calendar was one of the main reasons for the US Dollar (USD) to appreciate against most G8 currencies.
Data from the previous week, dominated by the Q4 Advanced GDP release, indicated a robust economy with a growth rate of 2.9%, exceeding predictions of 2.6% QoQ. Nevertheless, the pace was slower than the previous quarter’s 3.2%, as confirmed by the US Department of Commerce. Also, the release of the US Core Personal Consumption Expenditures (PCE), the Federal Reserve’s preferred measure of inflation, came within expectations and below November’s 4.7% YoY data, indicating inflation has declined for four consecutive months. Therefore, some Fed officials advocated for a slower pace of interest rate increases but stressed that no reductions are anticipated for 2023.
Reflection of the aforementioned is US Treasury bond yields, precisely the US 10-year benchmark note rate, finished Monday with gains of three and a half basis points (bps). Up at 3.542%, underpinned the greenback.
In the meantime, the CME FedWatcth Tool, odds for a 25 bps rate hike by the Fed stand at 97.6%, above last Friday’s 99% chances, though it’s priced in by the markets.
Ahead of the week, the US economic calendar will feature the Conference Board (CB) Consumer Confidence, alongside the S&P Global and ISM Manufacturing PMI readings for January, ahead of the Fed’s decision on Wednesday. On Thursday, Initial Jobless Claims and the ADP report, and the US Nonfarm Payrolls report on Friday.
Technical Levels: Supports and Resistances
EURUSD currently trading at 102.26 at the time of writing. Pair opened at 101.95 and is trading with a change of 0.3 % .
| Overview | Overview.1 | |
|---|---|---|
| 0 | Today last price | 102.26 |
| 1 | Today Daily Change | 0.31 |
| 2 | Today Daily Change % | 0.30 |
| 3 | Today daily open | 101.95 |
The pair remains strongly bearish on the daily time frame. It trades below the 20 SMA @ 102.82, 50 SMA 104.01, 100 SMA @ 107.01 and 200 SMA @ 106.74.
| Trends | Trends.1 | |
|---|---|---|
| 0 | Daily SMA20 | 102.82 |
| 1 | Daily SMA50 | 104.01 |
| 2 | Daily SMA100 | 107.01 |
| 3 | Daily SMA200 | 106.74 |
The previous day high was 102.19 while the previous day low was 101.68. The daily 38.2% Fib levels comes at 102.0, expected to provide support. Similarly, the daily 61.8% fib level is at 101.88, expected to provide support.
Note the levels of interest below:
- Pivot support is noted at 101.69, 101.43, 101.18
- Pivot resistance is noted at 102.2, 102.46, 102.72
| Levels | Levels.1 |
|---|---|
| Previous Daily High | 102.19 |
| Previous Daily Low | 101.68 |
| Previous Weekly High | 102.44 |
| Previous Weekly Low | 101.50 |
| Previous Monthly High | 106.02 |
| Previous Monthly Low | 103.39 |
| Daily Fibonacci 38.2% | 102.00 |
| Daily Fibonacci 61.8% | 101.88 |
| Daily Pivot Point S1 | 101.69 |
| Daily Pivot Point S2 | 101.43 |
| Daily Pivot Point S3 | 101.18 |
| Daily Pivot Point R1 | 102.20 |
| Daily Pivot Point R2 | 102.46 |
| Daily Pivot Point R3 | 102.72 |
[/s2If]
Join Our Telegram Group
")


