#EURUSD @ 1.08922 renews nine-month high inside short-term rising wedge., @nehcap view: Limited upside expected (Pivot Orderbook analysis)
…
This is a premium post.
[s2If !current_user_can(access_s2member_level4)]Please register for PREMIUM VERSION HERE to read full post below containing analysis. In case of any error or you think you are not able to read the full post below, please email us at support#nehcap.com [lwa][/s2If] [s2If current_user_can(access_s2member_level4)]
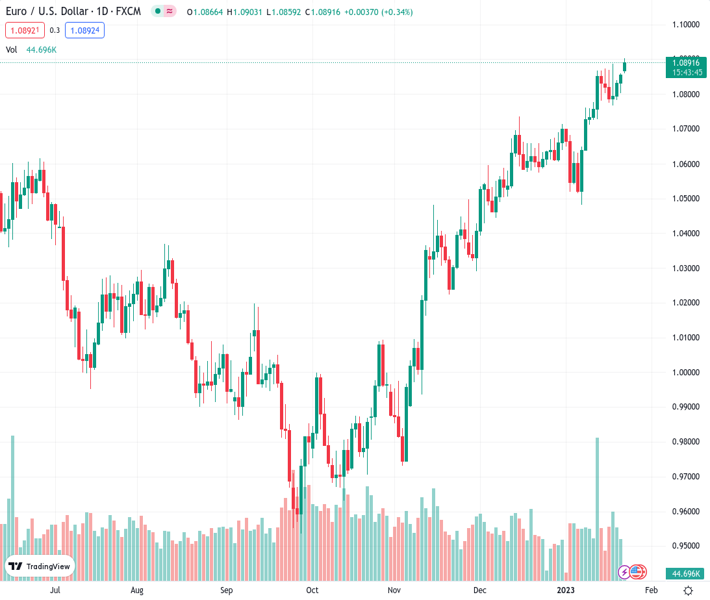
- EUR/USD renews nine-month high inside short-term rising wedge.
- Nearly overbought RSI conditions suggest limited room towards the north.
- 10-DMA restricts immediate downside, 1.0660 is the key support.
The pair currently trades last at 1.08922.
The previous day high was 1.0859 while the previous day low was 1.0802. The daily 38.2% Fib levels comes at 1.0838, expected to provide support. Similarly, the daily 61.8% fib level is at 1.0824, expected to provide support.
EUR/USD makes round to 1.0900 after rising to a fresh high since April 2022 heading into Monday’s European session.
In doing so, the Euro pair prints a three-day winning streak while staying firmer beyond the 10-DMA. However, the nearly overbought RSI and a 4.5-month-old rising wedge bearish chart formation challenges the buyers as of late.
It’s worth noting that the quote’s latest run-up aims for the April 2022 peak surrounding 1.0935 ahead of targeting the stated wedge’s top-line close to 1.0955.
Though, a successful run-up beyond 1.0955 will defy the bearish pattern and could quickly propel the prices toward the 1.1000 round figure.
In a case where the EUR/USD pair remains firmer past 1.1000, March 2022 peak surrounding 1.1185 will be in focus.
Alternatively, pullback moves remain elusive unless the quote stays above the 10-DMA support of 1.0815.
Following that, the 61.8% Fibonacci retracement level of the EUR/USD pair’s February-September 2022 downturn, around 1.0750, could lure the bears.
It should be observed that the EUR/USD’s weakness past 1.0750 highlights the stated wedge’s lower line, close to 1.0660, a break of which will confirm the bearish chart formation and can reverse the upward trajectory since late September 2022.
Trend: Limited upside expected
Technical Levels: Supports and Resistances
EURUSD currently trading at 1.0892 at the time of writing. Pair opened at 1.0856 and is trading with a change of 0.33% % .
| Overview | Overview.1 | |
|---|---|---|
| 0 | Today last price | 1.0892 |
| 1 | Today Daily Change | 0.0036 |
| 2 | Today Daily Change % | 0.33% |
| 3 | Today daily open | 1.0856 |
The pair remains strongly bullish on the daily timeframe. It trades above its 20 SMA @ 1.0711, 50 SMA 1.0571, 100 SMA @ 1.0232 and 200 SMA @ 1.031.
| Trends | Trends.1 | |
|---|---|---|
| 0 | Daily SMA20 | 1.0711 |
| 1 | Daily SMA50 | 1.0571 |
| 2 | Daily SMA100 | 1.0232 |
| 3 | Daily SMA200 | 1.0310 |
The previous day high was 1.0859 while the previous day low was 1.0802. The daily 38.2% Fib levels comes at 1.0838, expected to provide support. Similarly, the daily 61.8% fib level is at 1.0824, expected to provide support.
Note the levels of interest below:
- Pivot support is noted at 1.0819, 1.0782, 1.0762
- Pivot resistance is noted at 1.0876, 1.0896, 1.0933
| Levels | Levels.1 |
|---|---|
| Previous Daily High | 1.0859 |
| Previous Daily Low | 1.0802 |
| Previous Weekly High | 1.0888 |
| Previous Weekly Low | 1.0766 |
| Previous Monthly High | 1.0736 |
| Previous Monthly Low | 1.0393 |
| Daily Fibonacci 38.2% | 1.0838 |
| Daily Fibonacci 61.8% | 1.0824 |
| Daily Pivot Point S1 | 1.0819 |
| Daily Pivot Point S2 | 1.0782 |
| Daily Pivot Point S3 | 1.0762 |
| Daily Pivot Point R1 | 1.0876 |
| Daily Pivot Point R2 | 1.0896 |
| Daily Pivot Point R3 | 1.0933 |
[/s2If]
Join Our Telegram Group
")


