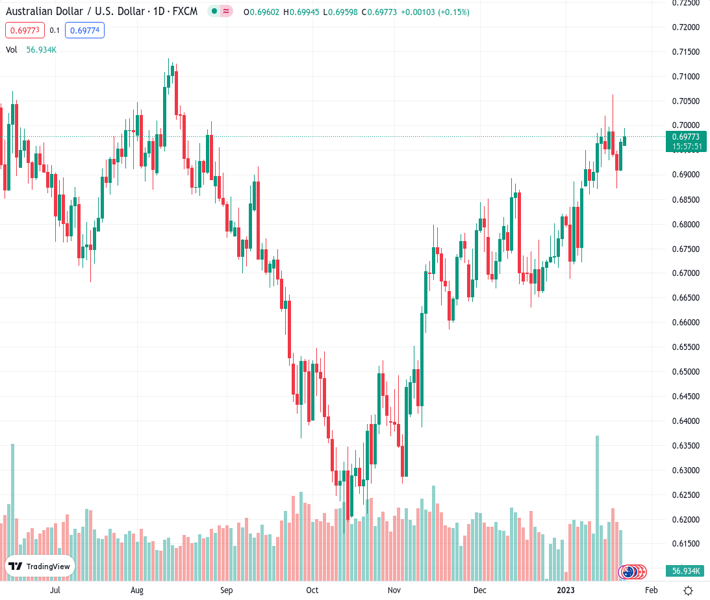
#AUDUSD @ 0.69785 clings to mild gains after snapping four-week uptrend. (Pivot Orderbook analysis)
…
This is a premium post.
[s2If !current_user_can(access_s2member_level4)]Please register for PREMIUM VERSION HERE to read full post below containing analysis. In case of any error or you think you are not able to read the full post below, please email us at support#nehcap.com [lwa][/s2If] [s2If current_user_can(access_s2member_level4)]
- AUD/USD clings to mild gains after snapping four-week uptrend.
- Risk appetite remains positive amid talks of soft landing, policy pivot in the US.
- China’s week-long Lunar New Year holidays, pre-Fed blackout restrict immediate moves.
- Australia CPI, US Q4 GDP will be crucial for fresh impulse.
The pair currently trades last at 0.69785.
The previous day high was 0.6974 while the previous day low was 0.6906. The daily 38.2% Fib levels comes at 0.6948, expected to provide support. Similarly, the daily 61.8% fib level is at 0.6932, expected to provide support.
AUD/USD seesaws around 0.6980-85 as it defends the week-start gains amid a sluggish Monday morning in Europe. In doing so, the Aussie pair remains mildly bid amid week-long holidays in China and the US Federal Reserve (Fed) policymakers’ stipulated off from the public appearances ahead of early February’s Federal Open Market Committee (FOMC) meeting.
It’s worth noting that the receding hopes of the global recession, as well as growing chatters surrounding the Fed’s policy pivot, seems to underpin the bullish bias surrounding the risk barometer pair AUD/USD.
Late the last week, International Monetary Fund (IMF) Managing Director Kristalina Georgieva said that the global “outlook is less bad than we feared a couple of months ago.” On the same line, JP Morgan Chase & Co. spotted seven indicators to suggest easing economic slowdown fears. Further, the US National Association of Business Economics (NABE) recently released a survey saying, “The likelihood that the United States is already in recession or will fall into one this year has dropped over the past three months to 56% from a nearly two-thirds possibility,” per Reuters.
Elsewhere, the Fed policymakers’ inability to convince of their hawkish bias, mainly due to the downbeat US data, joins optimism surrounding China to keep the AUD/USD buyers hopeful.
Amid these plays, the US Treasury yields remain pressured around multi-day, fading the last few days’ corrective bounces, while the US stock futures print mild losses and the Asia-Pacific equities trade mixed.
Given the lack of major data/events during the rest of the day, the AUD/USD pair may witness further grinding. However, Australia’s quarterly Consumer Price Index (CPI), up for publishing on Wednesday, will precede the US four-quarter (Q4) Gross Domestic Product (GDP) to entertain the pair traders.
Bearish Doji on the weekly chart, that too exactly below the 200-SMA, teases AUD/USD bears.
Technical Levels: Supports and Resistances
AUDUSD currently trading at 0.6984 at the time of writing. Pair opened at 0.697 and is trading with a change of 0.20% % .
| Overview | Overview.1 | |
|---|---|---|
| 0 | Today last price | 0.6984 |
| 1 | Today Daily Change | 0.0014 |
| 2 | Today Daily Change % | 0.20% |
| 3 | Today daily open | 0.697 |
The pair remains strongly bullish on the daily timeframe. It trades above its 20 SMA @ 0.6859, 50 SMA 0.678, 100 SMA @ 0.6641 and 200 SMA @ 0.6819.
| Trends | Trends.1 | |
|---|---|---|
| 0 | Daily SMA20 | 0.6859 |
| 1 | Daily SMA50 | 0.6780 |
| 2 | Daily SMA100 | 0.6641 |
| 3 | Daily SMA200 | 0.6819 |
The previous day high was 0.6974 while the previous day low was 0.6906. The daily 38.2% Fib levels comes at 0.6948, expected to provide support. Similarly, the daily 61.8% fib level is at 0.6932, expected to provide support.
Note the levels of interest below:
- Pivot support is noted at 0.6926, 0.6883, 0.6859
- Pivot resistance is noted at 0.6994, 0.7017, 0.7061
| Levels | Levels.1 |
|---|---|
| Previous Daily High | 0.6974 |
| Previous Daily Low | 0.6906 |
| Previous Weekly High | 0.7064 |
| Previous Weekly Low | 0.6872 |
| Previous Monthly High | 0.6893 |
| Previous Monthly Low | 0.6629 |
| Daily Fibonacci 38.2% | 0.6948 |
| Daily Fibonacci 61.8% | 0.6932 |
| Daily Pivot Point S1 | 0.6926 |
| Daily Pivot Point S2 | 0.6883 |
| Daily Pivot Point S3 | 0.6859 |
| Daily Pivot Point R1 | 0.6994 |
| Daily Pivot Point R2 | 0.7017 |
| Daily Pivot Point R3 | 0.7061 |
[/s2If]
Join Our Telegram Group
")


