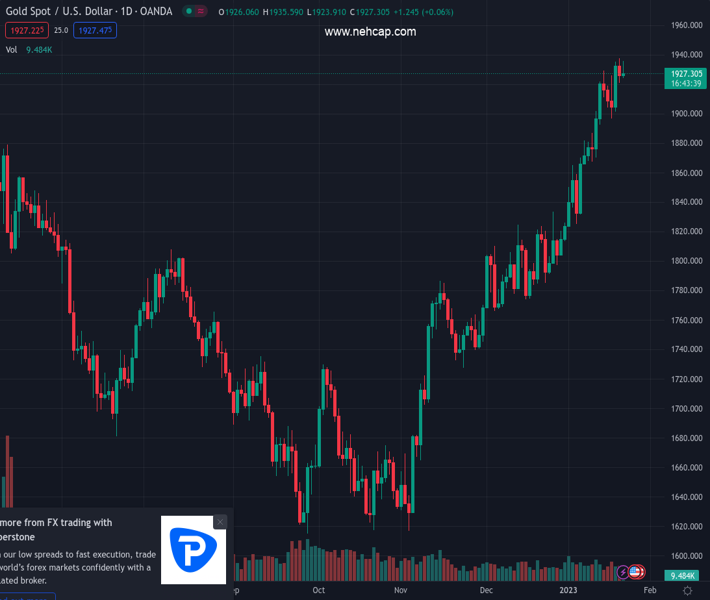
#XAUUSD @ 1,927.36 Gold price remains mildly bid near one-week-old resistance surrounding nine-month high., @nehcap view: Further upside expected (Pivot Orderbook analysis)
…
This is a premium post.
[s2If !current_user_can(access_s2member_level4)]Please register for PREMIUM VERSION HERE to read full post below containing analysis. In case of any error or you think you are not able to read the full post below, please email us at support#nehcap.com [lwa][/s2If] [s2If current_user_can(access_s2member_level4)]
- Gold price remains mildly bid near one-week-old resistance surrounding nine-month high.
- China’s Lunar New Year (LNY) holidays, pre-FOMC absence of Fed talks restrict market moves.
- Softer US Dollar keeps XAU/USD buyers hopeful ahead of PMIs, US Q4 GDP.
The pair currently trades last at 1927.36.
The previous day high was 1937.57 while the previous day low was 1920.71. The daily 38.2% Fib levels comes at 1927.15, expected to provide support. Similarly, the daily 61.8% fib level is at 1931.13, expected to provide resistance.
Gold price (XAU/USD) dribbles around $1,930 as bulls keep the reins after a five-week uptrend, printing mild gains to reverse the previous day’s pullback. In doing so, the precious metal aptly depicts the market’s conditions amid a light calendar and absence of Chinese traders, not to forget the Federal Reserve (Fed) policymakers’ stipulated off from the stage.
China’s Lunar New Year (LNY) celebrations restrict the market moves in Asia not only because the dragon nation is the biggest economy in the region but also because the nation’s reopening recently bolstered global markets. Even so, the market optimism surrounding Beijing remains on the table and keeps the Gold price firmer due to China’s dominance in the XAU/USD market.
On the other hand, Fed policymakers sneak into the two-week silence period ahead of the February Federal Open Market Committee (FOMC) and dropped the last sentences to defend the hawkish bias. Even so, the market forecasts Fed’s slow interest-rate increases for the second straight meeting in February, as well as the nearness to policy pivot. That said, downbeat US data and easing inflation woes underpinned the dovish market’s expectations from the US central bank.
Against this backdrop, the US Treasury yields remain pressured around multi-day, fading the last few days’ corrective bounces, while the US stock futures print mild losses and the Asia-Pacific equities trade mixed.
Although Gold traders have started the week in a sluggish mode, the first readings of January’s Purchasing Managers Indexes (PMI) and the US four-quarter (Q4) Gross Domestic Product (GDP) could offer active days ahead. That said, XAU/USD traders will be interested in softer US data to keep the latest upside momentum intact.
Gold price grinds higher around a nine-month top marked in the last week while staying inside a 13-day-old bullish channel formation, currently between $1,972 and $1,921.
That said, the impending bear cross on the MACD joins the XAU/USD failure to cross the one-week-old resistance line, close to $1,939 by the press time, to challenge the immediate upside.
It’s worth noting that the Gold price run-up beyond $1,972 could quickly challenge the April 2022 peak of $1,998 before targeting the $2,000 round figure.
Meanwhile, the firmer RSI (14) and the metal’s sustained trading beyond the 100-SMA level surrounding $1,880 keeps the Gold buyers hopeful.
To sum up, the Gold buyers appear to run out of steam but the bears are off the table unless the quote stays beyond $1,880.
Trend: Further upside expected
Technical Levels: Supports and Resistances
XAUUSD currently trading at 1929.58 at the time of writing. Pair opened at 1927.24 and is trading with a change of 0.12% % .
| Overview | Overview.1 | |
|---|---|---|
| 0 | Today last price | 1929.58 |
| 1 | Today Daily Change | 2.34 |
| 2 | Today Daily Change % | 0.12% |
| 3 | Today daily open | 1927.24 |
The pair remains strongly bullish on the daily timeframe. It trades above its 20 SMA @ 1865.17, 50 SMA 1812.5, 100 SMA @ 1744.14 and 200 SMA @ 1775.96.
| Trends | Trends.1 | |
|---|---|---|
| 0 | Daily SMA20 | 1865.17 |
| 1 | Daily SMA50 | 1812.50 |
| 2 | Daily SMA100 | 1744.14 |
| 3 | Daily SMA200 | 1775.96 |
The previous day high was 1937.57 while the previous day low was 1920.71. The daily 38.2% Fib levels comes at 1927.15, expected to provide support. Similarly, the daily 61.8% fib level is at 1931.13, expected to provide resistance.
Note the levels of interest below:
- Pivot support is noted at 1919.44, 1911.65, 1902.58
- Pivot resistance is noted at 1936.3, 1945.37, 1953.16
| Levels | Levels.1 |
|---|---|
| Previous Daily High | 1937.57 |
| Previous Daily Low | 1920.71 |
| Previous Weekly High | 1937.57 |
| Previous Weekly Low | 1896.63 |
| Previous Monthly High | 1833.38 |
| Previous Monthly Low | 1765.89 |
| Daily Fibonacci 38.2% | 1927.15 |
| Daily Fibonacci 61.8% | 1931.13 |
| Daily Pivot Point S1 | 1919.44 |
| Daily Pivot Point S2 | 1911.65 |
| Daily Pivot Point S3 | 1902.58 |
| Daily Pivot Point R1 | 1936.30 |
| Daily Pivot Point R2 | 1945.37 |
| Daily Pivot Point R3 | 1953.16 |
[/s2If]
Join Our Telegram Group
")


