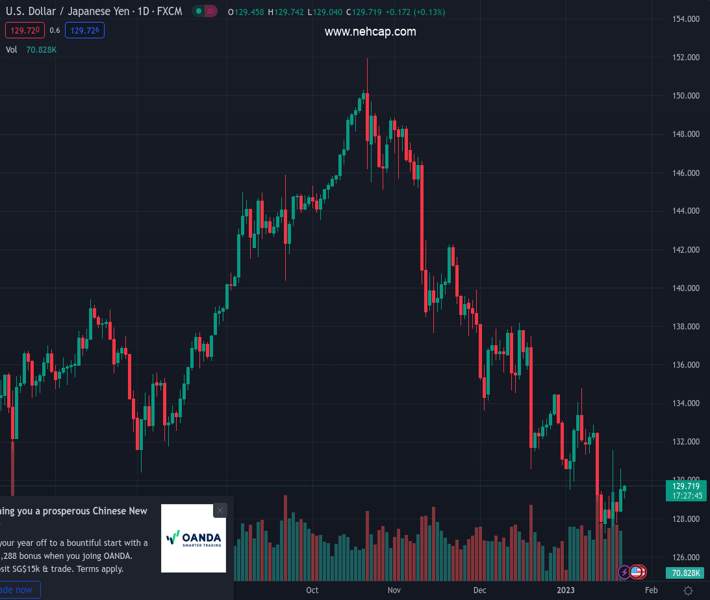
#USDJPY @ 129.700 is back in the red after seeing an impressive bounce on Friday. (Pivot Orderbook analysis)
…
This is a premium post.
[s2If !current_user_can(access_s2member_level4)]Please register for PREMIUM VERSION HERE to read full post below containing analysis. In case of any error or you think you are not able to read the full post below, please email us at support#nehcap.com [lwa][/s2If] [s2If current_user_can(access_s2member_level4)]
- USD/JPY is back in the red after seeing an impressive bounce on Friday.
- US Dollar and US Treasury bond yields stay weak on dovish Fed expectations.
- 21-DMA is likely to guard the upside as investors assess the BoJ Minutes.
The pair currently trades last at 129.700.
The previous day high was 130.61 while the previous day low was 128.35. The daily 38.2% Fib levels comes at 129.75, expected to provide resistance. Similarly, the daily 61.8% fib level is at 129.21, expected to provide support.
USD/JPY is attempting a minor rebound after nearly testing the 129.00 support level earlier in Asian trading this Monday. The sentiment around the currency pair remains undermined by sluggish US Treasury bond yields and a broadly weaker US Dollar.
The last words from the US Federal Reserve (Fed) policymakers just ahead of the Fed’s ‘blackout period’ were rather dovish, voicing support for smaller rate hikes. Meanwhile, the Fed’s whisperer and the Wall Street Journal’s (WSJ) Nick Timiraos tweeted out, “Fed officials are preparing to slow interest-rate increases for the second straight meeting. They could begin deliberating how much more softening in labor demand, spending and inflation they would need to see before pausing rate rises this spring.” The dovish Fed expectations continue to act as a headwind to the US Dollar.
Meanwhile, investors assess the Minutes of the Bank of Japan’s (BoJ) latest policy meeting, which showed that “several members said effects of powerful monetary easing will continue even if BoJ widens band around its yield target.” This is helping the Japanese Yen sellers to retain control amid holiday-thinned market conditions.
From a short-term technical perspective, USD/JPY is trading on the back, having faced rejection at the bearish 21-Daily Moving Average (DMA) a couple of times last week.
The 21DMA is now aligned at 131.03, above which the next powerful resistance is seen at the upper boundary of a falling wedge formation at 132.34.
The 14-day Relative Strength Index (RSI) is inching lower below the midline, suggesting that there is more room for a decline.
Immediate cushion awaits at the 128.00 level, which is the dashed trendline support. A fresh drop below the latter could see a retest of the lower boundary of the falling wedge, now at 126.32. All in all, the downside appears more compelling for the USD/JPY pair so long as it holds below the 21DMA hurdle.
Technical Levels: Supports and Resistances
USDJPY currently trading at 129.52 at the time of writing. Pair opened at 129.58 and is trading with a change of -0.04 % .
| Overview | Overview.1 | |
|---|---|---|
| 0 | Today last price | 129.52 |
| 1 | Today Daily Change | -0.05 |
| 2 | Today Daily Change % | -0.04 |
| 3 | Today daily open | 129.58 |
The pair remains strongly bearish on the daily time frame. It trades below the 20 SMA @ 131.12, 50 SMA 134.8, 100 SMA @ 140.09 and 200 SMA @ 136.71.
| Trends | Trends.1 | |
|---|---|---|
| 0 | Daily SMA20 | 131.12 |
| 1 | Daily SMA50 | 134.80 |
| 2 | Daily SMA100 | 140.09 |
| 3 | Daily SMA200 | 136.71 |
The previous day high was 130.61 while the previous day low was 128.35. The daily 38.2% Fib levels comes at 129.75, expected to provide resistance. Similarly, the daily 61.8% fib level is at 129.21, expected to provide support.
Note the levels of interest below:
- Pivot support is noted at 128.42, 127.25, 126.15
- Pivot resistance is noted at 130.68, 131.78, 132.95
| Levels | Levels.1 |
|---|---|
| Previous Daily High | 130.61 |
| Previous Daily Low | 128.35 |
| Previous Weekly High | 131.58 |
| Previous Weekly Low | 127.22 |
| Previous Monthly High | 138.18 |
| Previous Monthly Low | 130.57 |
| Daily Fibonacci 38.2% | 129.75 |
| Daily Fibonacci 61.8% | 129.21 |
| Daily Pivot Point S1 | 128.42 |
| Daily Pivot Point S2 | 127.25 |
| Daily Pivot Point S3 | 126.15 |
| Daily Pivot Point R1 | 130.68 |
| Daily Pivot Point R2 | 131.78 |
| Daily Pivot Point R3 | 132.95 |
[/s2If]
Join Our Telegram Group
")


