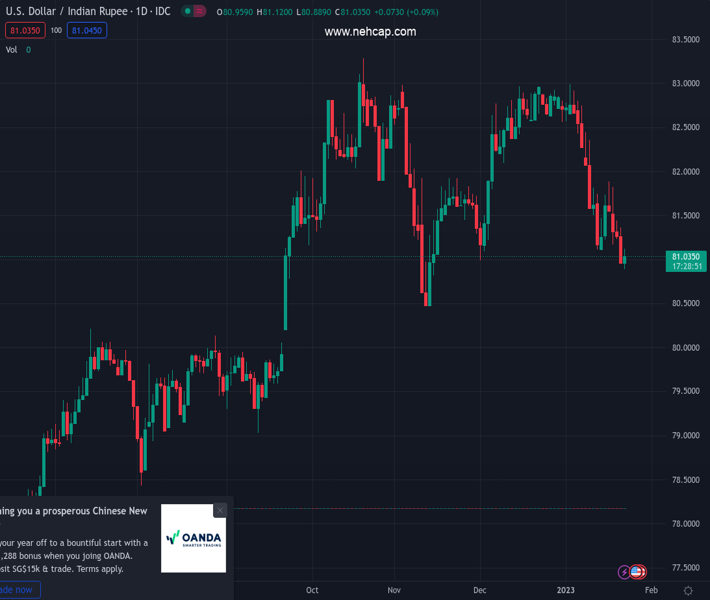
#USDINR @ 81.0450 licks its wound after refreshing multi-day low. (Pivot Orderbook analysis)
…
This is a premium post.
[s2If !current_user_can(access_s2member_level4)]Please register for PREMIUM VERSION HERE to read full post below containing analysis. In case of any error or you think you are not able to read the full post below, please email us at support#nehcap.com [lwa][/s2If] [s2If current_user_can(access_s2member_level4)]
- USD/INR licks its wound after refreshing multi-day low.
- Strong foreign inflow, broad US Dollar weakness underpins USD/INR slump.
- Hawkish Fed talks fail to impress USD bulls amid hopes of easy rate hike in February, policy pivot afterward.
- Markets expect RBI to curb Indian Rupee strength aroud 81.00 round figure, Advance readings of US Q4 GDP eyed too.
The pair currently trades last at 81.0450.
The previous day high was 81.3676 while the previous day low was 80.9595. The daily 38.2% Fib levels comes at 81.1154, expected to provide resistance. Similarly, the daily 61.8% fib level is at 81.2117, expected to provide resistance.
USD/INR pares intraday losses around 81.00, after declining to the lowest levels since early November 2022 during early Monday’s trading in India. In doing so, the Indian Rupee (INR) pair cheers the broad US Dollar weakness, as well as the heavy inflow to the Indian economy, while also portraying the fears of the Reserve Bank of India’s (RBI) market intervention.
That said, the US Dollar Index (DXY) drops 0.30% intraday to 101.65 by the press time, down for the fourth consecutive day in a row, amid cautious optimism in the market and the absence of Federal Reserve (Fed) talks during the two-week ‘blackout period’ before the Fed meeting.
The greenback’s gauge versus the six major currencies also highlights the market forecasts of the Fed’s slow interest-rate increases for the second straight meeting in February, as well as the nearness to policy pivot. That said, downbeat US data and easing inflation woes underpinned the dovish market’s expectations from the US central bank.
At home, heavy foreign inflows due to the major private players’ capital issues and hedgers’ activity seemed to have favored the INR as well. It should be noted that a jump in India’s foreign exchange reserves to a five-month high also favored the USD/INR bears. “India’s foreign exchange reserves rose to $572 billion in the week through Jan. 13, their highest level since early August last year, the Reserve Bank of India’s (RBI) statistical supplement showed on Friday,” said Reuters.
It’s worth noting that the Lunar New Year holidays in Asia and a lack of major data/events seem to have allowed the USD/INR buyers to take the risk. On the same line are the market chatters that the RBI will intervene to defend the pair from slipping beneath the 81.00 round figure.
Against this backdrop, US Treasury yields remain pressured while the US stock futures print mild gains while the stocks in the Asia-Pacific region trade mixed.
Moving on, an absence of Fedspeak and Chinese traders may restrict the USD/INR moves. However, the first readings of January’s Purchasing Managers Indexes (PMI) and the US four-quarter (Q4) Gross Domestic Product (GDP) will be the key to follow for clear directions.
Unless printing successful trading beyond the previous support line from early August 2022, close to 81.95 by the press time, the USD/INR pair is likely declining toward November 2022 low near 80.40.
Technical Levels: Supports and Resistances
USDINR currently trading at 80.978 at the time of writing. Pair opened at 80.976 and is trading with a change of 0.00% % .
| Overview | Overview.1 | |
|---|---|---|
| 0 | Today last price | 80.978 |
| 1 | Today Daily Change | 0.0020 |
| 2 | Today Daily Change % | 0.00% |
| 3 | Today daily open | 80.976 |
The pair is trading below its 20 Daily moving average @ 82.0752, below its 50 Daily moving average @ 82.0389 , below its 100 Daily moving average @ 81.7321 and above its 200 Daily moving average @ 80.0783
| Trends | Trends.1 | |
|---|---|---|
| 0 | Daily SMA20 | 82.0752 |
| 1 | Daily SMA50 | 82.0389 |
| 2 | Daily SMA100 | 81.7321 |
| 3 | Daily SMA200 | 80.0783 |
The previous day high was 81.3676 while the previous day low was 80.9595. The daily 38.2% Fib levels comes at 81.1154, expected to provide resistance. Similarly, the daily 61.8% fib level is at 81.2117, expected to provide resistance.
Note the levels of interest below:
- Pivot support is noted at 80.8344, 80.6929, 80.4263
- Pivot resistance is noted at 81.2426, 81.5092, 81.6507
| Levels | Levels.1 |
|---|---|
| Previous Daily High | 81.3676 |
| Previous Daily Low | 80.9595 |
| Previous Weekly High | 81.8865 |
| Previous Weekly Low | 80.9595 |
| Previous Monthly High | 84.2500 |
| Previous Monthly Low | 80.9855 |
| Daily Fibonacci 38.2% | 81.1154 |
| Daily Fibonacci 61.8% | 81.2117 |
| Daily Pivot Point S1 | 80.8344 |
| Daily Pivot Point S2 | 80.6929 |
| Daily Pivot Point S3 | 80.4263 |
| Daily Pivot Point R1 | 81.2426 |
| Daily Pivot Point R2 | 81.5092 |
| Daily Pivot Point R3 | 81.6507 |
[/s2If]
Join Our Telegram Group
")


