#EURJPY @ 140.679 bounced off the day’s lows at 139.03 and hit a daily high of 141.19 before losing steam. (Pivot Orderbook analysis)
…
This is a premium post.
[s2If !current_user_can(access_s2member_level4)]Please register for PREMIUM VERSION HERE to read full post below containing analysis. In case of any error or you think you are not able to read the full post below, please email us at support#nehcap.com [lwa][/s2If] [s2If current_user_can(access_s2member_level4)]
- EUR/JPY bounced off the day’s lows at 139.03 and hit a daily high of 141.19 before losing steam.
- The EUR/JPY reclaiming and achieving a daily close above the 200-day EMA keeps bulls hopeful of higher prices.
The pair currently trades last at 140.679.
The previous day high was 139.42 while the previous day low was 137.92. The daily 38.2% Fib levels comes at 138.85, expected to provide support. Similarly, the daily 61.8% fib level is at 138.49, expected to provide support.
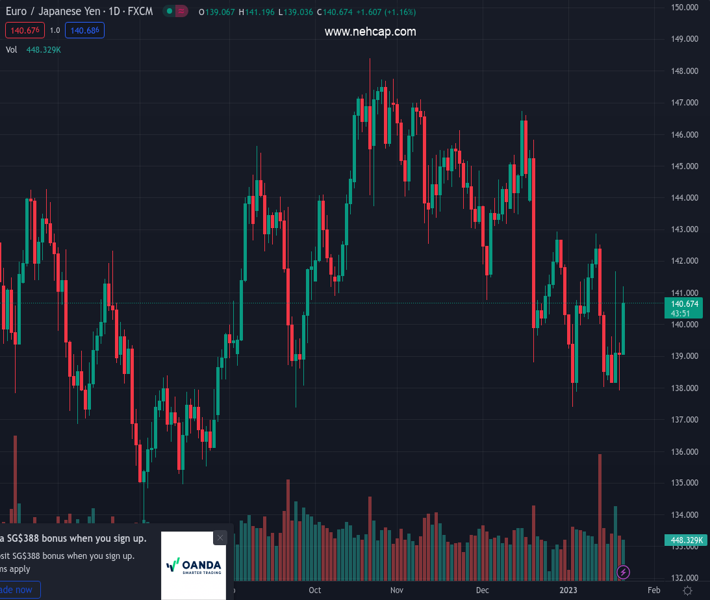
The Euro (EUR) rallies sharply on Friday, ahead of the weekend, as the Japanese Yen (JPY) weakened following the Bank of Japan’s (BoJ) monetary policy meeting, with the BoJ resolute in keeping its dovish stance, and the Yield Curve Control (YCC). Therefore, the EUR/JPY gains traction and exchanges hands at 140.63, above its opening price by more than 1%.
The EUR/JPY daily chart portrays the pair reclaiming the 20 and 200-day Exponential Moving Averages (EMAs), each at 140.45 and 140.15, respectively, keeping bulls hopeful for higher prices. Additionally, the Relative Strength Index (RSI) aims north and is about to turn bullish, further cementing the neutral-to-upward bias, while the Rate of Change (RoC) portrays strong bullish sentiment in the pair.
Therefore, the EUR/JPY path of least resistance is upwards. Hence, the EUR/JPY’s first resistance would be the January 20 high of 141.19, followed by the January 18 daily high at 141.68, and by the figure at 142.00. As an alternate scenario, EUR/JPY’s failure t crack 141.00 could pave the way for further downside. The EUR/JPY key support levels would be the 140.00 psychological level, followed by the January 20 daily low of 139.03, and then the January 19 swing low of 137.91.
Technical Levels: Supports and Resistances
EURJPY currently trading at 140.67 at the time of writing. Pair opened at 139.08 and is trading with a change of 1.14 % .
| Overview | Overview.1 | |
|---|---|---|
| 0 | Today last price | 140.67 |
| 1 | Today Daily Change | 1.59 |
| 2 | Today Daily Change % | 1.14 |
| 3 | Today daily open | 139.08 |
The pair is trading above its 20 Daily moving average @ 140.45, below its 50 Daily moving average @ 142.5 , below its 100 Daily moving average @ 143.13 and below its 200 Daily moving average @ 140.76
| Trends | Trends.1 | |
|---|---|---|
| 0 | Daily SMA20 | 140.45 |
| 1 | Daily SMA50 | 142.50 |
| 2 | Daily SMA100 | 143.13 |
| 3 | Daily SMA200 | 140.76 |
The previous day high was 139.42 while the previous day low was 137.92. The daily 38.2% Fib levels comes at 138.85, expected to provide support. Similarly, the daily 61.8% fib level is at 138.49, expected to provide support.
Note the levels of interest below:
- Pivot support is noted at 138.19, 137.3, 136.69
- Pivot resistance is noted at 139.7, 140.31, 141.21
| Levels | Levels.1 |
|---|---|
| Previous Daily High | 139.42 |
| Previous Daily Low | 137.92 |
| Previous Weekly High | 142.86 |
| Previous Weekly Low | 138.01 |
| Previous Monthly High | 146.73 |
| Previous Monthly Low | 138.80 |
| Daily Fibonacci 38.2% | 138.85 |
| Daily Fibonacci 61.8% | 138.49 |
| Daily Pivot Point S1 | 138.19 |
| Daily Pivot Point S2 | 137.30 |
| Daily Pivot Point S3 | 136.69 |
| Daily Pivot Point R1 | 139.70 |
| Daily Pivot Point R2 | 140.31 |
| Daily Pivot Point R3 | 141.21 |
[/s2If]
Join Our Telegram Group
")


