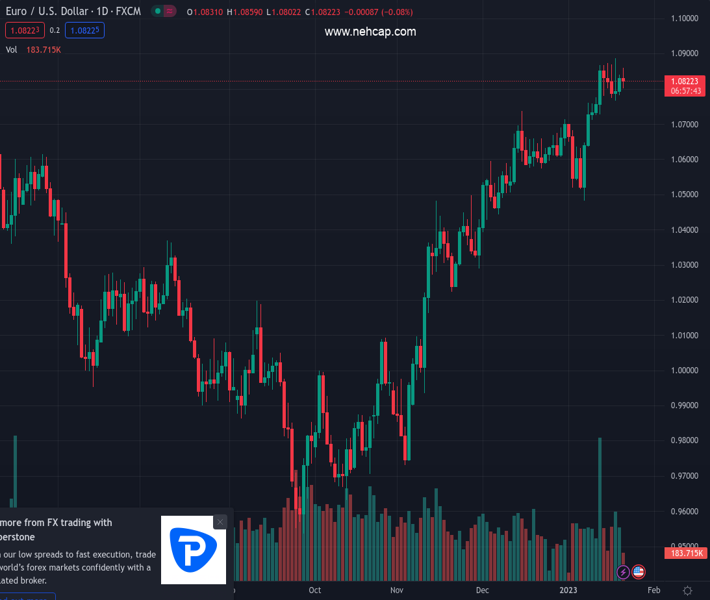
#EURUSD @ 1.08210 comes under pressure but remains bolstered by 1.0800. (Pivot Orderbook analysis)
…
This is a premium post.
[s2If !current_user_can(access_s2member_level4)]Please register for PREMIUM VERSION HERE to read full post below containing analysis. In case of any error or you think you are not able to read the full post below, please email us at support#nehcap.com [lwa][/s2If] [s2If current_user_can(access_s2member_level4)]
- EUR/USD comes under pressure but remains bolstered by 1.0800.
- Next on the upside emerges the key barrier at 1.0900 the figure.
The pair currently trades last at 1.08210.
The previous day high was 1.084 while the previous day low was 1.0782. The daily 38.2% Fib levels comes at 1.0818, expected to provide support. Similarly, the daily 61.8% fib level is at 1.0804, expected to provide support.
EUR/USD fades the initial test of the 1.0860 region and returns to the negative territory on Friday.
Extra range bound mood looks likely for the time being, while the surpass of the so far YTD top at 1.0887 (January 18) should rapidly allow a move to the round level at 1.0900.
While above the short-term support line near 1.0620, extra gains should remain in store for the pair.
In the longer run, the constructive view remains unchanged while above the 200-day SMA at 1.0307.
Technical Levels: Supports and Resistances
EURUSD currently trading at 1.0815 at the time of writing. Pair opened at 1.0829 and is trading with a change of -0.13 % .
| Overview | Overview.1 | |
|---|---|---|
| 0 | Today last price | 1.0815 |
| 1 | Today Daily Change | 57.0000 |
| 2 | Today Daily Change % | -0.1300 |
| 3 | Today daily open | 1.0829 |
The pair remains strongly bullish on the daily timeframe. It trades above its 20 SMA @ 1.0699, 50 SMA 1.0561, 100 SMA @ 1.0223 and 200 SMA @ 1.031.
| Trends | Trends.1 | |
|---|---|---|
| 0 | Daily SMA20 | 1.0699 |
| 1 | Daily SMA50 | 1.0561 |
| 2 | Daily SMA100 | 1.0223 |
| 3 | Daily SMA200 | 1.0310 |
The previous day high was 1.084 while the previous day low was 1.0782. The daily 38.2% Fib levels comes at 1.0818, expected to provide support. Similarly, the daily 61.8% fib level is at 1.0804, expected to provide support.
Note the levels of interest below:
- Pivot support is noted at 1.0794, 1.0759, 1.0736
- Pivot resistance is noted at 1.0852, 1.0875, 1.091
| Levels | Levels.1 |
|---|---|
| Previous Daily High | 1.0840 |
| Previous Daily Low | 1.0782 |
| Previous Weekly High | 1.0868 |
| Previous Weekly Low | 1.0639 |
| Previous Monthly High | 1.0736 |
| Previous Monthly Low | 1.0393 |
| Daily Fibonacci 38.2% | 1.0818 |
| Daily Fibonacci 61.8% | 1.0804 |
| Daily Pivot Point S1 | 1.0794 |
| Daily Pivot Point S2 | 1.0759 |
| Daily Pivot Point S3 | 1.0736 |
| Daily Pivot Point R1 | 1.0852 |
| Daily Pivot Point R2 | 1.0875 |
| Daily Pivot Point R3 | 1.0910 |
[/s2If]
Join Our Telegram Group
")


