Asian stocks are modestly positive following a rebound move from S&P500 futures. (Pivot Orderbook analysis)
…
This is a premium post.
[s2If !current_user_can(access_s2member_level4)]Please register for PREMIUM VERSION HERE to read full post below containing analysis. In case of any error or you think you are not able to read the full post below, please email us at support#nehcap.com [lwa][/s2If] [s2If current_user_can(access_s2member_level4)]
- Asian stocks are modestly positive following a rebound move from S&P500 futures.
- Chinese equities have picked strength despite an unchanged monetary policy by the PBoC.
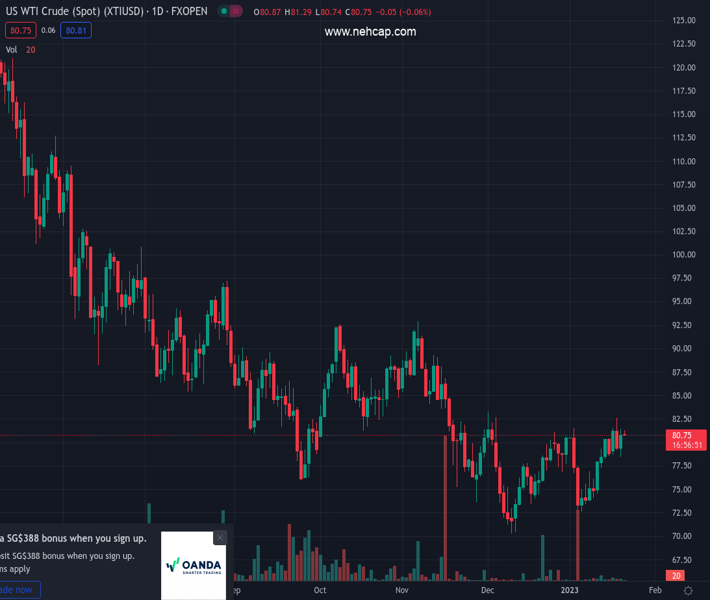
- Oil price has overstepped $81.00 resistance amid optimism over China’s reopening.
The pair currently trades last at 26367.49.
The previous day high was 26454.75 while the previous day low was 26287.53. The daily 38.2% Fib levels comes at 26390.87, expected to provide resistance. Similarly, the daily 61.8% fib level is at 26351.41, expected to provide support.
Markets in the Asian domain are displaying modest gains following the recovery move in the S&P500 futures in the Asian session. Technically, the 500-United States stock basket futures have rebounded as oscillators have turned extremely oversold after a three-day losing streak. Still, it is critical to consider the current risk profile a positive one as the US Dollar Index (DXY) is attempting to come out of the woods and has refreshed its day high at 101.80.
At the press time, Japan’s Nikkei225 gained 0.26%, ChinaA50 climbed 0.44%, Hang Seng jumped 1.06%, and Nifty50 eased 0.18%.
The demand for US government bonds is easing further as Federal Reserve (Fed) policymakers are continuously chattering about the continuation of higher interest rates for a longer period of time as the journey towards the 2% inflation goal is far from over. The 10-year US Treasury yields have climbed above 3.41%.
Japanese equities have sensed buying interest following the release of mixed Japan’s National Consumer Price Index (CPI) data. Japan’s National headline CPI has landed at 4.0%, lower than the consensus of 4.4% but higher than the former release of 3.8%. While the core inflation that excludes oil and food prices has soared to 3.0% higher than the expectations of 2.9% and the prior release of 2.8%. National CPI that excludes fresh food has remained in line with the estimates at 4.0%.
Meanwhile, Chinese stocks have picked strength despite the People’s Bank of China (PBoC) announcing an unchanged monetary policy. The PBoC kept its Loan Prime Rates (LPRs) steady consecutively for the fifth month. PBoC’s deputy governor Xuan Changneng recently said that the board had pledged to take further measures to boost market confidence and increase support for manufacturers and small companies, amid hopes that the economy will stage a solid rebound in CY2023.
On the oil front, oil prices have surpassed the critical resistance of $81.00. The black gold has picked strength despite bumper oil stockpiles reported by the Energy Information Administration (EIA) on Thursday for the week ending January 13. The EIA reported a significant jump in oil inventories by 8.408 million barrels.
Technical Levels: Supports and Resistances
XTIUSD currently trading at 26367.49 at the time of writing. Pair opened at 26367.49 and is trading with a change of 0.0 % .
| Overview | Overview.1 | |
|---|---|---|
| 0 | Today last price | 26367.49 |
| 1 | Today Daily Change | 0.00 |
| 2 | Today Daily Change % | 0.00 |
| 3 | Today daily open | 26367.49 |
The pair is trading above its 20 Daily moving average @ 26147.6, below its 50 Daily moving average @ 27133.36 , below its 100 Daily moving average @ 27210.63 and below its 200 Daily moving average @ 27206.91
| Trends | Trends.1 | |
|---|---|---|
| 0 | Daily SMA20 | 26147.60 |
| 1 | Daily SMA50 | 27133.36 |
| 2 | Daily SMA100 | 27210.63 |
| 3 | Daily SMA200 | 27206.91 |
The previous day high was 26454.75 while the previous day low was 26287.53. The daily 38.2% Fib levels comes at 26390.87, expected to provide resistance. Similarly, the daily 61.8% fib level is at 26351.41, expected to provide support.
Note the levels of interest below:
- Pivot support is noted at 26285.1, 26202.7, 26117.88
- Pivot resistance is noted at 26452.32, 26537.14, 26619.54
| Levels | Levels.1 |
|---|---|
| Previous Daily High | 26454.75 |
| Previous Daily Low | 26287.53 |
| Previous Weekly High | 26578.67 |
| Previous Weekly Low | 25721.43 |
| Previous Monthly High | 28325.89 |
| Previous Monthly Low | 25793.22 |
| Daily Fibonacci 38.2% | 26390.87 |
| Daily Fibonacci 61.8% | 26351.41 |
| Daily Pivot Point S1 | 26285.10 |
| Daily Pivot Point S2 | 26202.70 |
| Daily Pivot Point S3 | 26117.88 |
| Daily Pivot Point R1 | 26452.32 |
| Daily Pivot Point R2 | 26537.14 |
| Daily Pivot Point R3 | 26619.54 |
[/s2If]
Join Our Telegram Group
")


