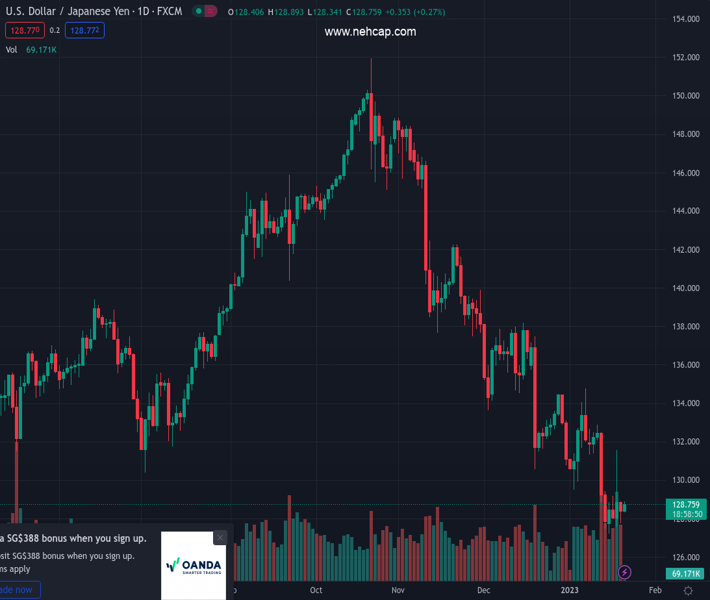
#USDJPY @ 128.789 picks up bids to reverse the previous day’s losses inside one-week-old symmetrical triangle., @nehcap view: Limited upside expected (Pivot Orderbook analysis)
…
This is a premium post.
[s2If !current_user_can(access_s2member_level4)]Please register for PREMIUM VERSION HERE to read full post below containing analysis. In case of any error or you think you are not able to read the full post below, please email us at support#nehcap.com [lwa][/s2If] [s2If current_user_can(access_s2member_level4)]
- USD/JPY picks up bids to reverse the previous day’s losses inside one-week-old symmetrical triangle.
- Gradually firming oscillators suggest further grinding towards the north.
- Monthly descending trend line, 200-EMA add to the upside filters.
The pair currently trades last at 128.789.
The previous day high was 128.93 while the previous day low was 127.76. The daily 38.2% Fib levels comes at 128.21, expected to provide support. Similarly, the daily 61.8% fib level is at 128.49, expected to provide support.
USD/JPY adds strength to the weekly gains as bulls flirt with the intraday high of around 128.80 during early Friday. In doing so, the Yen pair stays inside a one-week-old symmetrical triangle while extending the bounce off the lowest levels since late May 2022.
That said, the gradually firming RSI (14) line, not overbought, joins the bullish MACD signals to underpin the hopes of the quote’s further advances.
As a result, the USD/JPY buyers are up for challenging the 129.00 round figure. However, the early-January swing low near 129.50 and the 130.00 psychological magnet could challenge the quote’s further upside.
In a case where the USD/JPY prices rally beyond 130.00, the 100-Exponential Moving Average (EMA) and the upper line of the stated triangle, respectively around 130.70 and 131.10, could probe the bulls.
Also acting as a strong upside challenge for the pair is the downward-sloping resistance line from mid-December 2022 and the 200-EMA, respectively near 132.65 and 132.85.
On the flip side, an ascending trend line from Monday, close to 127.85, restricts immediate USD/JPY declines before the monthly low of 127.21.
It’s worth observing that the lows marked during late May 2022 near 126.35 could act as the last defense of the USD/JPY buyers.
Overall, USD/JPY is likely to consolidate the latest losses but the upside room appears limited.
Trend: Limited upside expected
Technical Levels: Supports and Resistances
USDJPY currently trading at 128.75 at the time of writing. Pair opened at 128.44 and is trading with a change of 0.24% % .
| Overview | Overview.1 | |
|---|---|---|
| 0 | Today last price | 128.75 |
| 1 | Today Daily Change | 0.31 |
| 2 | Today Daily Change % | 0.24% |
| 3 | Today daily open | 128.44 |
The pair remains strongly bearish on the daily time frame. It trades below the 20 SMA @ 131.28, 50 SMA 134.98, 100 SMA @ 140.2 and 200 SMA @ 136.7.
| Trends | Trends.1 | |
|---|---|---|
| 0 | Daily SMA20 | 131.28 |
| 1 | Daily SMA50 | 134.98 |
| 2 | Daily SMA100 | 140.20 |
| 3 | Daily SMA200 | 136.70 |
The previous day high was 128.93 while the previous day low was 127.76. The daily 38.2% Fib levels comes at 128.21, expected to provide support. Similarly, the daily 61.8% fib level is at 128.49, expected to provide support.
Note the levels of interest below:
- Pivot support is noted at 127.82, 127.2, 126.65
- Pivot resistance is noted at 128.99, 129.55, 130.16
| Levels | Levels.1 |
|---|---|
| Previous Daily High | 128.93 |
| Previous Daily Low | 127.76 |
| Previous Weekly High | 132.87 |
| Previous Weekly Low | 127.46 |
| Previous Monthly High | 138.18 |
| Previous Monthly Low | 130.57 |
| Daily Fibonacci 38.2% | 128.21 |
| Daily Fibonacci 61.8% | 128.49 |
| Daily Pivot Point S1 | 127.82 |
| Daily Pivot Point S2 | 127.20 |
| Daily Pivot Point S3 | 126.65 |
| Daily Pivot Point R1 | 128.99 |
| Daily Pivot Point R2 | 129.55 |
| Daily Pivot Point R3 | 130.16 |
[/s2If]
Join Our Telegram Group
")


