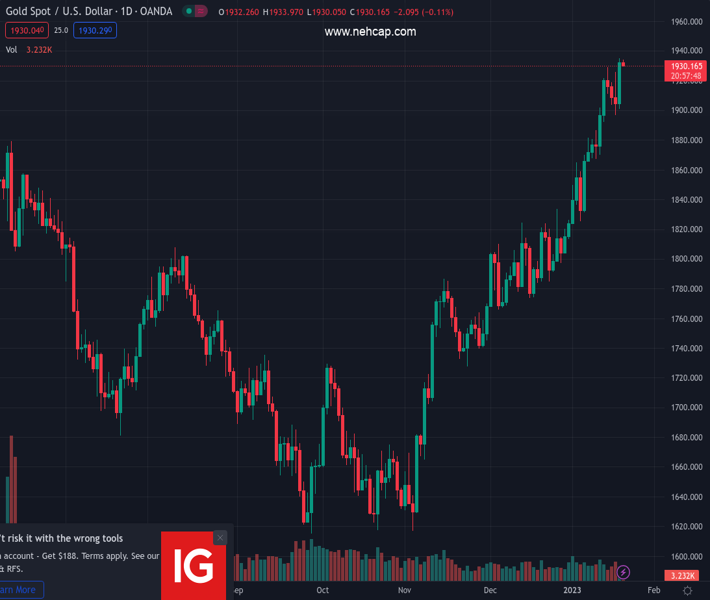
#XAUUSD @ 1,930.41 Gold price seesaws after refreshing nine-month high, retreats of late., @nehcap view: Further upside expected (Pivot Orderbook analysis)
…
This is a premium post.
[s2If !current_user_can(access_s2member_level4)]Please register for PREMIUM VERSION HERE to read full post below containing analysis. In case of any error or you think you are not able to read the full post below, please email us at support#nehcap.com [lwa][/s2If] [s2If current_user_can(access_s2member_level4)]
- Gold price seesaws after refreshing nine-month high, retreats of late.
- Hawkish Federal Reserve comments fail to underpin US Dollar rebound despite poking XAU/USD bulls.
- Latest statistics from United States renew recession fears in the world’s largest economy and favor Gold buyers.
The pair currently trades last at 1930.41.
The previous day high was 1935.27 while the previous day low was 1901.0. The daily 38.2% Fib levels comes at 1922.18, expected to provide support. Similarly, the daily 61.8% fib level is at 1914.09, expected to provide support.
Gold price (XA/USD) make rounds to $1,930 during Friday’s sluggish Asian session, after rising to the highest levels since April 2022 the previous day. In doing so, the bright metal seems to weigh the latest Federal Reserve (Fed) comments with the fears of the economic slowdown in the United States. However, the downbeat US Dollar and optimism surrounding China keep the XAU/USD buyers hopeful.
Although the recent US weekly jobless claims and monthly sentiment gauge from Philadelphia Fed appeared impressive, Gold buyers concentrated on the broadly downbeat US numbers to cheer the recession woes surrounding the world’s largest economy. That said, the US Unemployment Claims dropped to the lowest levels since late April 2022, to 190K for the week ended on January 13 versus 214K expected and 205K prior. Further, the Philadelphia Fed Manufacturing Survey Index improved to -8.9 for January compared to -11.0 market forecasts and -13.7 previous readings. However, US Building Permits eased in December to 1.33M MoM versus 1.37M consensus and 1.351M prior while the Housing Starts also dropped to 1.382M during the stated month from 1.401M in November, versus 1.359M expected. It’s worth noting that the downbeat US Retail Sales and Producer Price Index (PPI) raised fears of an economic slowdown in the world’s largest economy after the softer wage growth and activity data flashed earlier.
Recently, Federal Reserve Bank of New York President John Williams said that the US central bank has more rate hikes ahead and sees signs inflationary pressures might be starting to cool off from torrid levels. Late Thursday, Fed Vice Chair Lael Brainard said that it will take time and resolve to get high inflation down to the fed’s 2% target. The policymaker also added, “The policy will need to be sufficiently restrictive for some time.” On the same line, Boston Fed President Collins signaled that the baseline remains that the effective fed funds rate should settle slightly above 5.0%, implying three more 25bp rate rises.
Hence, most of the Fed speakers are hawkish as they sneak into the two-week blackout period ahead of February’s Federal Open Market Committee (FOMC) meeting. Even so, the US Dollar Index (DXY) remains pressured and braces for the second weekly loss, which in turn favors the XAU/USD bulls. It’s worth noting that the United States Treasury bond yields bounced off the multi-day low following the recent bout of hawkish Fed commentary, which in turn challenges the Gold buyers.
China’s reopening ahead of the Lunar New Year holidays bolstered Gold buyers’ confidence as the dragon nation is among the major XAU/USD consumers. On the same line, the People’s Bank of China’s (PBOC) readiness to keep the rates low and Chinese governing bodies’ readiness for further stimulus, especially for the struggling real-estate sector, keeps the Gold buyers hopeful. Additionally, Beijing’s latest diplomatic efforts to improvise the political ties with the West also underpin the positive sentiment of the bullion buyers.
Given the lack of major data/events scheduled for publishing, XAU/USD traders should keep their eyes on the Federal Reserve (Fed) talks for clear directions. Should the policymakers keep their hawkish bias, the Gold price may witness a pullback toward the key support of around $1,890.
Gold’s successful rebound from a 10-month-old horizontal support joins bullish signals from the Moving Average Convergence and Divergence (MACD) indicator to hint at the yellow metal’s further upside.
It’s worth noting, however, that the overbought conditions of the Relative Strength Index (RSI) line, placed at 14, suggest that the Gold buyers need to keep the reins beyond the early month high surrounding $1,930 to aim for the late March 2022 peak of $1,966.
Following that, April 2022 high and the previous yearly top, respectively near $1,999 and $2,070, could lure the XAU/USD buyers.
Alternatively, the 10-day Exponential Moving Average (EMA) restricts the metal’s immediate downside near $1,902 before the aforementioned horizontal support area of $1,895-90.
Should the quote breaks the said horizontal support, June 2022 high near $1,880 may act as an additional downside filter for the Gold price, a break of which won’t hesitate to direct bears towards August month’s high near $1,808.
Overall, the Gold price remains on the bull’s radar even if the overbought RSI tests immediate advances.
Trend: Further upside expected
Technical Levels: Supports and Resistances
XAUUSD currently trading at 1931.91 at the time of writing. Pair opened at 1933.54 and is trading with a change of -0.08% % .
| Overview | Overview.1 | |
|---|---|---|
| 0 | Today last price | 1931.91 |
| 1 | Today Daily Change | -1.63 |
| 2 | Today Daily Change % | -0.08% |
| 3 | Today daily open | 1933.54 |
The pair remains strongly bullish on the daily timeframe. It trades above its 20 SMA @ 1858.69, 50 SMA 1809.31, 100 SMA @ 1741.99 and 200 SMA @ 1776.2.
| Trends | Trends.1 | |
|---|---|---|
| 0 | Daily SMA20 | 1858.69 |
| 1 | Daily SMA50 | 1809.31 |
| 2 | Daily SMA100 | 1741.99 |
| 3 | Daily SMA200 | 1776.20 |
The previous day high was 1935.27 while the previous day low was 1901.0. The daily 38.2% Fib levels comes at 1922.18, expected to provide support. Similarly, the daily 61.8% fib level is at 1914.09, expected to provide support.
Note the levels of interest below:
- Pivot support is noted at 1911.27, 1889.0, 1877.0
- Pivot resistance is noted at 1945.54, 1957.54, 1979.81
| Levels | Levels.1 |
|---|---|
| Previous Daily High | 1935.27 |
| Previous Daily Low | 1901.00 |
| Previous Weekly High | 1921.96 |
| Previous Weekly Low | 1865.22 |
| Previous Monthly High | 1833.38 |
| Previous Monthly Low | 1765.89 |
| Daily Fibonacci 38.2% | 1922.18 |
| Daily Fibonacci 61.8% | 1914.09 |
| Daily Pivot Point S1 | 1911.27 |
| Daily Pivot Point S2 | 1889.00 |
| Daily Pivot Point S3 | 1877.00 |
| Daily Pivot Point R1 | 1945.54 |
| Daily Pivot Point R2 | 1957.54 |
| Daily Pivot Point R3 | 1979.81 |
[/s2If]
Join Our Telegram Group
")


