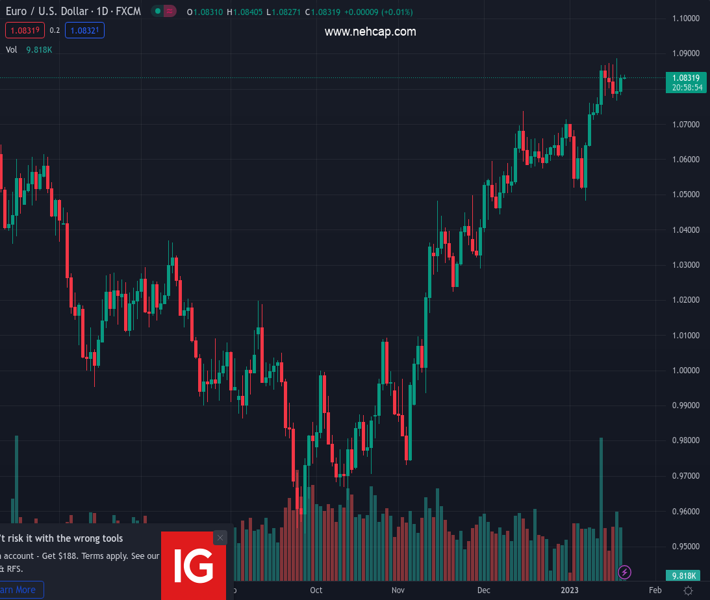
#EURUSD @ 1.08312 is aiming to stretch its recovery move above 1.0840 as investors’ risk-taking capacity is improving. (Pivot Orderbook analysis)
…
This is a premium post.
[s2If !current_user_can(access_s2member_level4)]Please register for PREMIUM VERSION HERE to read full post below containing analysis. In case of any error or you think you are not able to read the full post below, please email us at support#nehcap.com [lwa][/s2If] [s2If current_user_can(access_s2member_level4)]
- EUR/USD is aiming to stretch its recovery move above 1.0840 as investors’ risk-taking capacity is improving.
- The formation of an Ascending Triangle chart pattern indicates a volatility contraction.
- The Euro may continue to find support from the 200-EMA ahead.
The pair currently trades last at 1.08312.
The previous day high was 1.084 while the previous day low was 1.0782. The daily 38.2% Fib levels comes at 1.0818, expected to provide support. Similarly, the daily 61.8% fib level is at 1.0804, expected to provide support.
The EUR/USD pair is on the verge of surpassing the immediate resistance of 1.0840 in the Asian session. The major currency pair is looking to extend its recovery move as the US Dollar Index (DXY) has dropped to near 101.60.
Positive market sentiment is gaining traction as the S&P500 futures are displaying decent recovery signals after a three-day losing spell. Also, the 10-year US Treasury yields have crossed 3.40% after a hawkish commentary from New York Federal Reserve (Fed) Bank President John Williams as the policymaker sees a continuation of interest rates hikes as the road to 2% inflation is far from over.
EUR/USD has rebounded after sensing buying interest around the upward-sloping trendline of the Ascending Triangle chart pattern plotted from January 10 low at 1.0712 on an hourly scale. The horizontal resistance of the aforementioned chart pattern is placed from January 12 high at 1.0867. The chart pattern indicates volatility contraction and awaits a potential trigger for an explosion.
The 200-period Exponential Moving Average (EMA) at 1.0780 is acting as a major support for the Euro.
Meanwhile, the Relative Strength Index (RSI) (14) is oscillating in a 40.00-60.00 range, which indicates a consolidation ahead.
An explosive move above January 18 high at 1.0888 will trigger a breakout of the Ascending Triangle, which will drive the major currency pair for a fresh nine-month high above April 21 high at 1.0936 followed by the psychological resistance at 1.1000.
On the flip side, a decisive break below January 13 low at 1.0780 will drag the asset towards January 12 low at 1.0731. A slippage below the latter will expose the asset for more downside towards the round-level support at 1.0700.
Technical Levels: Supports and Resistances
EURUSD currently trading at 1.0834 at the time of writing. Pair opened at 1.0829 and is trading with a change of 0.05 % .
| Overview | Overview.1 | |
|---|---|---|
| 0 | Today last price | 1.0834 |
| 1 | Today Daily Change | 0.0005 |
| 2 | Today Daily Change % | 0.0500 |
| 3 | Today daily open | 1.0829 |
The pair remains strongly bullish on the daily timeframe. It trades above its 20 SMA @ 1.0699, 50 SMA 1.0561, 100 SMA @ 1.0223 and 200 SMA @ 1.031.
| Trends | Trends.1 | |
|---|---|---|
| 0 | Daily SMA20 | 1.0699 |
| 1 | Daily SMA50 | 1.0561 |
| 2 | Daily SMA100 | 1.0223 |
| 3 | Daily SMA200 | 1.0310 |
The previous day high was 1.084 while the previous day low was 1.0782. The daily 38.2% Fib levels comes at 1.0818, expected to provide support. Similarly, the daily 61.8% fib level is at 1.0804, expected to provide support.
Note the levels of interest below:
- Pivot support is noted at 1.0794, 1.0759, 1.0736
- Pivot resistance is noted at 1.0852, 1.0875, 1.091
| Levels | Levels.1 |
|---|---|
| Previous Daily High | 1.0840 |
| Previous Daily Low | 1.0782 |
| Previous Weekly High | 1.0868 |
| Previous Weekly Low | 1.0639 |
| Previous Monthly High | 1.0736 |
| Previous Monthly Low | 1.0393 |
| Daily Fibonacci 38.2% | 1.0818 |
| Daily Fibonacci 61.8% | 1.0804 |
| Daily Pivot Point S1 | 1.0794 |
| Daily Pivot Point S2 | 1.0759 |
| Daily Pivot Point S3 | 1.0736 |
| Daily Pivot Point R1 | 1.0852 |
| Daily Pivot Point R2 | 1.0875 |
| Daily Pivot Point R3 | 1.0910 |
[/s2If]
Join Our Telegram Group
")


