#EURJPY @ 139.174 is range-bound around 139.00 awaiting the release of Japanese CPI. (Pivot Orderbook analysis)
…
This is a premium post.
[s2If !current_user_can(access_s2member_level4)]Please register for PREMIUM VERSION HERE to read full post below containing analysis. In case of any error or you think you are not able to read the full post below, please email us at support#nehcap.com [lwa][/s2If] [s2If current_user_can(access_s2member_level4)]
- EUR/JPY is range-bound around 139.00 awaiting the release of Japanese CPI.
- EUR/JPY Price Analysis: Bullish above 140.00; otherwise, exposed to selling pressure.
The pair currently trades last at 139.174.
The previous day high was 141.69 while the previous day low was 138.18. The daily 38.2% Fib levels comes at 140.35, expected to provide resistance. Similarly, the daily 61.8% fib level is at 139.52, expected to provide resistance.
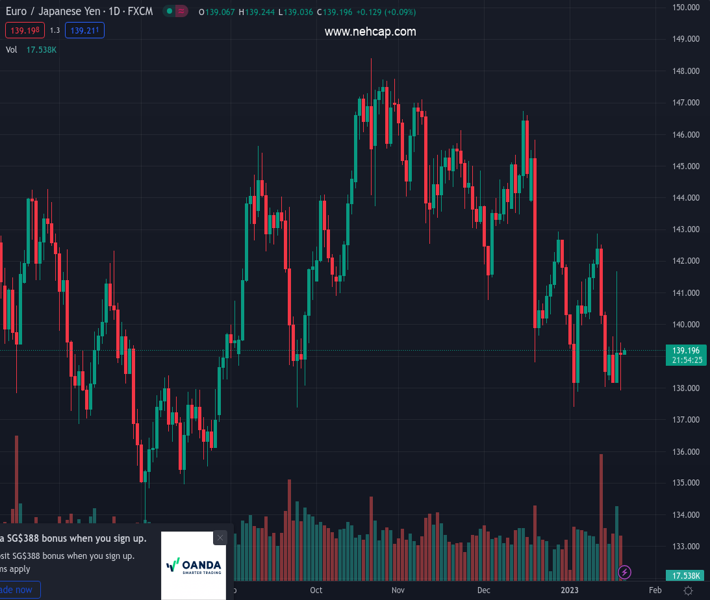
The EUR/JPY finished Thursday’s session flat and remained trading sideways ahead of December’s release of the Japanese Consumer Price Index (CPI). As the Asian session begins, the EUR/JPY is trading at 139.06, almost flat.
The EUR/JPY daily chart portrays the pair as neutral-downward biased, as it remains below the daily Exponential Moving Averages (EMAs). Also, the 20-day EMA at 140.29 is about to cross below the 200-day EMA at 140.14, which would resume the downtrend in the near term. Solid support is found around the last week’s low of 138.01, tested on Thursday, though the EUR/JPY quickly rebounded towards the 139.00 figure.
Oscillators-wise, the Relative Strength Index (RSI) in the bearish territory is flat, while the Rate of Change (RoC), portrays buyers losing momentum. Therefore, the EUR/JPY remains sideways, awaiting a possible breakout.
The EUR/JPY first support would be 138.00. A breach of the latter would send the pair aiming towards 137.38, the YTD low, followed by the September 26 pivot low at 137.36. on the upside, the EUR/JPY first resistance would be the 200-day EMA at 140.14, which, once cleared, could expose additional resistance levels. The 20-day EMA at 140.30 would be put in play, followed by the 141.00 figure.
Technical Levels: Supports and Resistances
EURJPY currently trading at 139.1 at the time of writing. Pair opened at 139.04 and is trading with a change of 0.04 % .
| Overview | Overview.1 | |
|---|---|---|
| 0 | Today last price | 139.10 |
| 1 | Today Daily Change | 0.06 |
| 2 | Today Daily Change % | 0.04 |
| 3 | Today daily open | 139.04 |
The pair remains strongly bearish on the daily time frame. It trades below the 20 SMA @ 140.51, 50 SMA 142.6, 100 SMA @ 143.13 and 200 SMA @ 140.74.
| Trends | Trends.1 | |
|---|---|---|
| 0 | Daily SMA20 | 140.51 |
| 1 | Daily SMA50 | 142.60 |
| 2 | Daily SMA100 | 143.13 |
| 3 | Daily SMA200 | 140.74 |
The previous day high was 141.69 while the previous day low was 138.18. The daily 38.2% Fib levels comes at 140.35, expected to provide resistance. Similarly, the daily 61.8% fib level is at 139.52, expected to provide resistance.
Note the levels of interest below:
- Pivot support is noted at 137.58, 136.12, 134.07
- Pivot resistance is noted at 141.1, 143.15, 144.61
| Levels | Levels.1 |
|---|---|
| Previous Daily High | 141.69 |
| Previous Daily Low | 138.18 |
| Previous Weekly High | 142.86 |
| Previous Weekly Low | 138.01 |
| Previous Monthly High | 146.73 |
| Previous Monthly Low | 138.80 |
| Daily Fibonacci 38.2% | 140.35 |
| Daily Fibonacci 61.8% | 139.52 |
| Daily Pivot Point S1 | 137.58 |
| Daily Pivot Point S2 | 136.12 |
| Daily Pivot Point S3 | 134.07 |
| Daily Pivot Point R1 | 141.10 |
| Daily Pivot Point R2 | 143.15 |
| Daily Pivot Point R3 | 144.61 |
[/s2If]
Join Our Telegram Group
")


