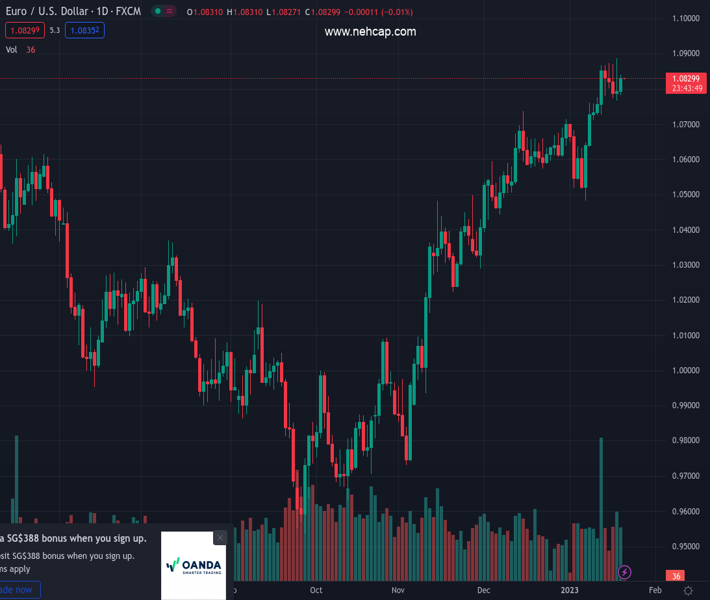
#EURUSD @ 1.08299 is looking to stretch its recovery move above 1.0840 amid soaring hawkish ECB bets. (Pivot Orderbook analysis)
…
This is a premium post.
[s2If !current_user_can(access_s2member_level4)]Please register for PREMIUM VERSION HERE to read full post below containing analysis. In case of any error or you think you are not able to read the full post below, please email us at support#nehcap.com [lwa][/s2If] [s2If current_user_can(access_s2member_level4)]
- EUR/USD is looking to stretch its recovery move above 1.0840 amid soaring hawkish ECB bets.
- Weakness in S&P500 due to soaring recession fears are restricting the upside in the risk-perceived currencies.
- US Treasury yields have displayed a recovery after printing fresh multi-month lows.
The pair currently trades last at 1.08299.
The previous day high was 1.0888 while the previous day low was 1.0766. The daily 38.2% Fib levels comes at 1.0813, expected to provide support. Similarly, the daily 61.8% fib level is at 1.0841, expected to provide resistance.
The EUR/USD pair is struggling to extend its rebound above the immediate resistance of 1.0840 in the early Asian session. The major currency pair is expected to stretch its recovery move amid hawkish commentary from European Central Bank (ECB) President Christine Lagarde and hawkish cues from ECB December meeting accounts.
Fineprints from ECB’s Monetary Policy Meeting Accounts indicated that the majority of the policymakers were favoring an interest rate hike by 75 basis points (bps) but later supported the view of ECB President Christine Lagarde that it might dampen the overall demand and favored a 50 bps interest rate hike.
ECB Lagarde at World Economic Forum (WEF), in Davos reiterated the view that inflation is too high, however, the ECB is determined to bring it down to 2% in a timely manner. She further added that “We may only see a small contraction in the Eurozone.”
The market mood remained risk-averse amid escalating chances of a recession in the United States economy. Analysts at Wells Fargo stated that US Industrial Production fell 0.7% in December and November’s numbers were revised lower. With industrial production has fallen in six of the past eight months, the largest of which being November and December, it is evident that the manufacturing sector is already in recession.
Further, Vice Chair Lael Brainard said “significant weakening in the manufacturing sector,” a moderation in consumer spending, and other data pointing to now “subdued growth” in 2023.
S&P500 is facing the impact of the solidifying case of recession. The 500-stock basket recorded a three-day losing streak, portraying negative market sentiment. The demand for US government bonds faded after remaining firmer in the past few sessions. The 10-year US Treasury yields rebounded to near 3.39% after recording a fresh five-month low at 3.33%. Meanwhile, the US Dollar index (DXY) has dropped to near 101.60 after surrendering the critical support of 101.80.
Technical Levels: Supports and Resistances
EURUSD currently trading at 1.0835 at the time of writing. Pair opened at 1.0789 and is trading with a change of 0.43 % .
| Overview | Overview.1 | |
|---|---|---|
| 0 | Today last price | 1.0835 |
| 1 | Today Daily Change | 0.0046 |
| 2 | Today Daily Change % | 0.4300 |
| 3 | Today daily open | 1.0789 |
The pair remains strongly bullish on the daily timeframe. It trades above its 20 SMA @ 1.0687, 50 SMA 1.0548, 100 SMA @ 1.0214 and 200 SMA @ 1.031.
| Trends | Trends.1 | |
|---|---|---|
| 0 | Daily SMA20 | 1.0687 |
| 1 | Daily SMA50 | 1.0548 |
| 2 | Daily SMA100 | 1.0214 |
| 3 | Daily SMA200 | 1.0310 |
The previous day high was 1.0888 while the previous day low was 1.0766. The daily 38.2% Fib levels comes at 1.0813, expected to provide support. Similarly, the daily 61.8% fib level is at 1.0841, expected to provide resistance.
Note the levels of interest below:
- Pivot support is noted at 1.0741, 1.0693, 1.062
- Pivot resistance is noted at 1.0862, 1.0936, 1.0984
| Levels | Levels.1 |
|---|---|
| Previous Daily High | 1.0888 |
| Previous Daily Low | 1.0766 |
| Previous Weekly High | 1.0868 |
| Previous Weekly Low | 1.0639 |
| Previous Monthly High | 1.0736 |
| Previous Monthly Low | 1.0393 |
| Daily Fibonacci 38.2% | 1.0813 |
| Daily Fibonacci 61.8% | 1.0841 |
| Daily Pivot Point S1 | 1.0741 |
| Daily Pivot Point S2 | 1.0693 |
| Daily Pivot Point S3 | 1.0620 |
| Daily Pivot Point R1 | 1.0862 |
| Daily Pivot Point R2 | 1.0936 |
| Daily Pivot Point R3 | 1.0984 |
[/s2If]
Join Our Telegram Group
")


