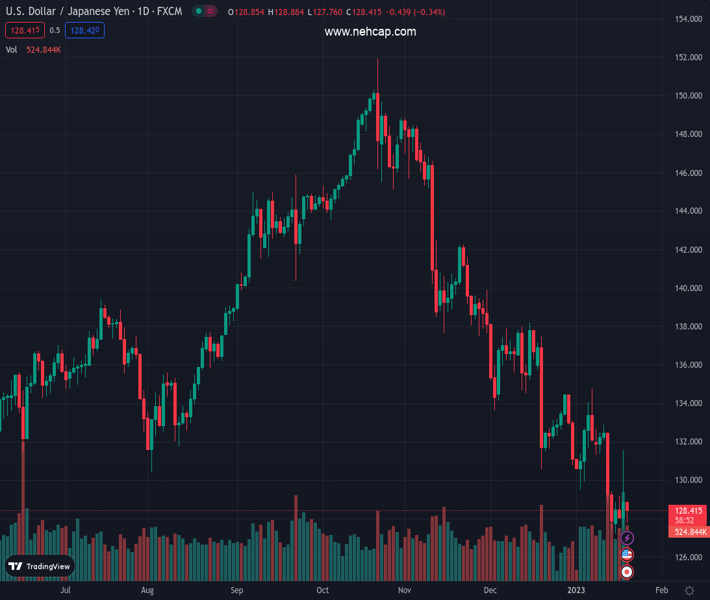
#USDJPY @ 128.421 hovers around Wednesday’s close of 128.85, aiming to close below to extend its downtrend. (Pivot Orderbook analysis)
…
This is a premium post.
[s2If !current_user_can(access_s2member_level4)]Please register for PREMIUM VERSION HERE to read full post below containing analysis. In case of any error or you think you are not able to read the full post below, please email us at support#nehcap.com [lwa][/s2If] [s2If current_user_can(access_s2member_level4)]
- USD/JPY hovers around Wednesday’s close of 128.85, aiming to close below to extend its downtrend.
- Unemployment claims in the US came lower than expected, as traders expect further tightening.
- Japanese inflation data is expected to edge higher; what would the BoJ do?
The pair currently trades last at 128.421.
The previous day high was 131.58 while the previous day low was 127.57. The daily 38.2% Fib levels comes at 130.05, expected to provide resistance. Similarly, the daily 61.8% fib level is at 129.1, expected to provide resistance.
The USD/JPY reverses its course and edges lower late in the North American session, down by 0.33% on Thursday. Risk aversion weighed on the US Dollar (USD), which extended its losses but was capped by the rise in US Treasury bond yields. At the time of writing, the USD/JPY is trading at 128.33 after hitting a daily high of 128.88.
Wall Street continues to show a dampened mood. Thursday’s economic data in the United States (US) pointed to a tight labor market, as Initial Jobless Claims for the last week edged lower, by 190K less than the 214K consensus. Further data reported that the US housing market continues to deteriorate. Housing Starts and Building Permits missed estimates, while the Philadelphia Fed Manufacturing Index, although in contractionary territory at -8.9, improved compared to November’s -13.7 reading.
As traders brace for a critical Japanese inflation report, the USD/JPY has been hovering around 128.40 for the last three hours.
Last month’s inflation in Japan rose by 3.8% YoY in November, exceeding October’s 3.7%. Excluding fresh foods but including fuel costs rose by 3.7% YoY vs. 3.6% on its previous reading. Excluding food and energy, the so-called core Consumer Price Index (CPI) rose by 2.8%.
If the Japanese CPI increased above last month’s figures, that could result in the USD/JPY prolonging its downtrend, and it might test the YTD low of 127.21, followed by a challenge to the May 24 swing low at 126.36.
Elsewhere. the US Dollar Index, a measure of the buck against a basket of peers, extended its losses for two straight days, sliding 0.34% to 102.034.
Also read: USD/JPY Price Analysis: The yen strengthens, as bears stepped in around 128.60s
The Japanese economic calendar will feature inflation figures. On the US front, the US calendar will feature Existing Home Sales alongside Fed speaking.
Technical Levels: Supports and Resistances
USDJPY currently trading at 128.44 at the time of writing. Pair opened at 128.87 and is trading with a change of -0.33 % .
| Overview | Overview.1 | |
|---|---|---|
| 0 | Today last price | 128.44 |
| 1 | Today Daily Change | -0.43 |
| 2 | Today Daily Change % | -0.33 |
| 3 | Today daily open | 128.87 |
The pair remains strongly bearish on the daily time frame. It trades below the 20 SMA @ 131.48, 50 SMA 135.24, 100 SMA @ 140.32 and 200 SMA @ 136.68.
| Trends | Trends.1 | |
|---|---|---|
| 0 | Daily SMA20 | 131.48 |
| 1 | Daily SMA50 | 135.24 |
| 2 | Daily SMA100 | 140.32 |
| 3 | Daily SMA200 | 136.68 |
The previous day high was 131.58 while the previous day low was 127.57. The daily 38.2% Fib levels comes at 130.05, expected to provide resistance. Similarly, the daily 61.8% fib level is at 129.1, expected to provide resistance.
Note the levels of interest below:
- Pivot support is noted at 127.1, 125.33, 123.08
- Pivot resistance is noted at 131.11, 133.35, 135.12
| Levels | Levels.1 |
|---|---|
| Previous Daily High | 131.58 |
| Previous Daily Low | 127.57 |
| Previous Weekly High | 132.87 |
| Previous Weekly Low | 127.46 |
| Previous Monthly High | 138.18 |
| Previous Monthly Low | 130.57 |
| Daily Fibonacci 38.2% | 130.05 |
| Daily Fibonacci 61.8% | 129.10 |
| Daily Pivot Point S1 | 127.10 |
| Daily Pivot Point S2 | 125.33 |
| Daily Pivot Point S3 | 123.08 |
| Daily Pivot Point R1 | 131.11 |
| Daily Pivot Point R2 | 133.35 |
| Daily Pivot Point R3 | 135.12 |
[/s2If]
Join Our Telegram Group
")


