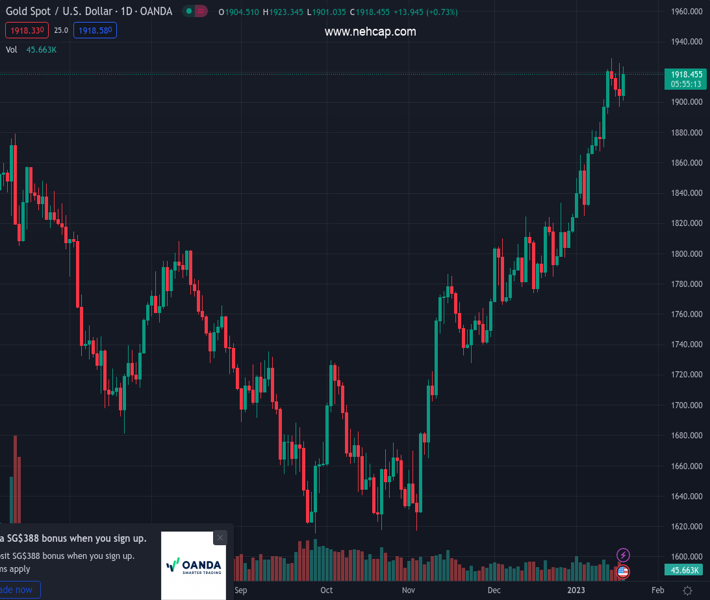
#XAUUSD @ 1,918.86 Gold buyers stepped in around $1901 and lifted the yellow metal amidst an offered US Dollar. (Pivot Orderbook analysis)
…
This is a premium post.
[s2If !current_user_can(access_s2member_level4)]Please register for PREMIUM VERSION HERE to read full post below containing analysis. In case of any error or you think you are not able to read the full post below, please email us at support#nehcap.com [lwa][/s2If] [s2If current_user_can(access_s2member_level4)]
- Gold buyers stepped in around $1901 and lifted the yellow metal amidst an offered US Dollar.
- Weak US economic data revealed on Wednesday increased the likelihood of a US recession.
- Sentiment remains dampened, although US unemployment claims edged lower.
- Federal Reserve officials continued to express the need to lift rates above 5%.
The pair currently trades last at 1918.86.
The previous day high was 1925.95 while the previous day low was 1896.63. The daily 38.2% Fib levels comes at 1907.83, expected to provide support. Similarly, the daily 61.8% fib level is at 1914.75, expected to provide support.
Gold price snaps two days of losses and grinds higher on Thursday, lifted by a weak US Dollar (USD) and a dampened market mood, as Wall Street opened with losses. Soft US economic data released on Wednesday sounded the alarms of an upcoming recession amidst a high inflation environment. Therefore, the XAU/USD is trading at 1921.54, above its opening price by 0.95%.
Before the US cash equity markets opened, the US Department of Labor revealed that Initial Jobless Claims for the week ending January 14 rose by 190K, less than the 214K estimated. The same report updated Continuing Jobless Claims rising to 1647K beneath the 1660K foreseen. At the same time, Building Permits dropped less than estimates, and the percentage change compared to November’s -10.6%, improved to -1.6%.
Staying in the US housing market data, Housing Starts slid to -1.4%, less than November’s -1.8% contraction. Aside from this, the Philadelphia Fed Manufacturing Index in the US rose to -8.9 in January from a revised -13.7 plunge in December. The report showed that more than 33% of the firms reported declines in activity.
Elsewhere, the US Dollar Index, a gauge of the buck’s value against a basket of G7 currencies, slides 0.17%, down at 102.239, while US bond yields recover some ground. The 10-year benchmark note rate sits at 3.397%, up two bps.
Money market futures traders are pricing in a 25 bps rate hike at the Federal Reserve’s January 31-February 1 meeting.
Despite softer-than-expected US economic data revealed on Wednesday, with Retail Sales plunging and Industrial Production nosediving, nevertheless, Fed officials stayed the course, vocal about lifting rates at least to the 5% threshold.
On Thursday, Boston Fed President Susan Collins said that it was appropriate to slow the pace of rate increases, though she emphasized its need to move above 5% and be held around for “some time.”
XAU/USD daily chart supports the thesis of higher Gold prices. But buyers need to decisively clear the January 16 swing high of $1928 if they want to climb toward $2000. Once XAU/USD clears the former, that would pave the way to a $1958.April 20 swing high, ahead of the $2000 figure. Otherwise, a correction to $1900 is on the cards.
Technical Levels: Supports and Resistances
XAUUSD currently trading at 1919.71 at the time of writing. Pair opened at 1903.47 and is trading with a change of 0.85 % .
| Overview | Overview.1 | |
|---|---|---|
| 0 | Today last price | 1919.71 |
| 1 | Today Daily Change | 16.24 |
| 2 | Today Daily Change % | 0.85 |
| 3 | Today daily open | 1903.47 |
The pair remains strongly bullish on the daily timeframe. It trades above its 20 SMA @ 1851.62, 50 SMA 1805.76, 100 SMA @ 1739.63 and 200 SMA @ 1776.42.
| Trends | Trends.1 | |
|---|---|---|
| 0 | Daily SMA20 | 1851.62 |
| 1 | Daily SMA50 | 1805.76 |
| 2 | Daily SMA100 | 1739.63 |
| 3 | Daily SMA200 | 1776.42 |
The previous day high was 1925.95 while the previous day low was 1896.63. The daily 38.2% Fib levels comes at 1907.83, expected to provide support. Similarly, the daily 61.8% fib level is at 1914.75, expected to provide support.
Note the levels of interest below:
- Pivot support is noted at 1891.42, 1879.36, 1862.1
- Pivot resistance is noted at 1920.74, 1938.0, 1950.06
| Levels | Levels.1 |
|---|---|
| Previous Daily High | 1925.95 |
| Previous Daily Low | 1896.63 |
| Previous Weekly High | 1921.96 |
| Previous Weekly Low | 1865.22 |
| Previous Monthly High | 1833.38 |
| Previous Monthly Low | 1765.89 |
| Daily Fibonacci 38.2% | 1907.83 |
| Daily Fibonacci 61.8% | 1914.75 |
| Daily Pivot Point S1 | 1891.42 |
| Daily Pivot Point S2 | 1879.36 |
| Daily Pivot Point S3 | 1862.10 |
| Daily Pivot Point R1 | 1920.74 |
| Daily Pivot Point R2 | 1938.00 |
| Daily Pivot Point R3 | 1950.06 |
[/s2If]
Join Our Telegram Group
")


