#NZDUSD @ 0.63933 US economic data help risk appetite and the New Zealand Dollar. (Pivot Orderbook analysis)
…
This is a premium post.
[s2If !current_user_can(access_s2member_level4)]Please register for PREMIUM VERSION HERE to read full post below containing analysis. In case of any error or you think you are not able to read the full post below, please email us at support#nehcap.com [lwa][/s2If] [s2If current_user_can(access_s2member_level4)]
- US economic data help risk appetite and the New Zealand Dollar.
- Wall Street is in red after the opening but off lows, commodities rebound.
- NZD/USD attempts to regain 0.6400, still negative for the day.
- NZ Prime Minister Jacinda Ardens to step down.
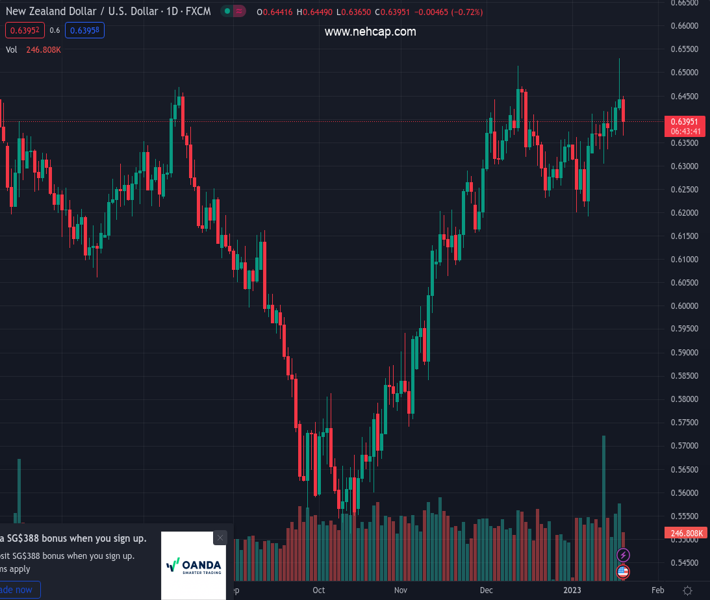
The pair currently trades last at 0.63933.
The previous day high was 0.6531 while the previous day low was 0.637. The daily 38.2% Fib levels comes at 0.6469, expected to provide resistance. Similarly, the daily 61.8% fib level is at 0.6431, expected to provide resistance.
The NZD/USD rebounded from the lowest level since last Friday and climbed to 0.6402, supported by an improvement in market sentiment following the release of better-than-expected US economic data. The New Zealand Dollar is still down for the day, unaffected by the resignation of NZ PM Jacinda Ardens.
Thursday is proving to be a different day than Wednesday when Retail Sales and Industrial Production reports showed larger-than-expected declines for December. Data released on Thursday came in mostly above expectations. Initial Jobless Claims fell below 200K to the lowest level in four months. The Philly Fed rose more from -13.7 to -8.9.
The economic figures helped the US Dollar but also risk appetite that ended up weighing more on the greenback, pushing NZD/USD away from the lows. Equity prices in Wall Street are still down but off lows, falling on average 0.50%. Crude oil and gold are rising by around 0.54%.
New Zealand Prime Minister Jacinda Ardern announced her term would end by February 7. She “does not have the energy” to seek re-election in the general elections that will take place on October 14. A new leader will be voted in a few days. The announcement had little impact on the kiwi. The NZ main stock index fell 0.28%.
The AUD/NZD bottomed during the Asian session at 1.0735 following the weaker-than-expected Australian employment report and then rebounded and turned positive for the day. It is back above 1.0800.
The NZD/USD is looking to trade back in the range with support at 0.6330/50 and resistance at 0.6410/20, after the retreat from the multi-month high it reached on Wednesday at 0.6529. The bias is still to the upside, as it holds above the 20-day Simple Moving Average that stands at 0.6335.
A firm daily close above 0.6450 should point to a test of the recent top and toward more gains. If NZD/USD is unable to do so in the short term, a deeper correction seems likely.
Technical Levels: Supports and Resistances
NZDUSD currently trading at 0.64 at the time of writing. Pair opened at 0.6429 and is trading with a change of -0.45 % .
| Overview | Overview.1 | |
|---|---|---|
| 0 | Today last price | 0.6400 |
| 1 | Today Daily Change | -0.0029 |
| 2 | Today Daily Change % | -0.4500 |
| 3 | Today daily open | 0.6429 |
The pair remains strongly bullish on the daily timeframe. It trades above its 20 SMA @ 0.6334, 50 SMA 0.6296, 100 SMA @ 0.6057 and 200 SMA @ 0.6204.
| Trends | Trends.1 | |
|---|---|---|
| 0 | Daily SMA20 | 0.6334 |
| 1 | Daily SMA50 | 0.6296 |
| 2 | Daily SMA100 | 0.6057 |
| 3 | Daily SMA200 | 0.6204 |
The previous day high was 0.6531 while the previous day low was 0.637. The daily 38.2% Fib levels comes at 0.6469, expected to provide resistance. Similarly, the daily 61.8% fib level is at 0.6431, expected to provide resistance.
Note the levels of interest below:
- Pivot support is noted at 0.6356, 0.6282, 0.6194
- Pivot resistance is noted at 0.6517, 0.6604, 0.6678
| Levels | Levels.1 |
|---|---|
| Previous Daily High | 0.6531 |
| Previous Daily Low | 0.6370 |
| Previous Weekly High | 0.6418 |
| Previous Weekly Low | 0.6314 |
| Previous Monthly High | 0.6514 |
| Previous Monthly Low | 0.6230 |
| Daily Fibonacci 38.2% | 0.6469 |
| Daily Fibonacci 61.8% | 0.6431 |
| Daily Pivot Point S1 | 0.6356 |
| Daily Pivot Point S2 | 0.6282 |
| Daily Pivot Point S3 | 0.6194 |
| Daily Pivot Point R1 | 0.6517 |
| Daily Pivot Point R2 | 0.6604 |
| Daily Pivot Point R3 | 0.6678 |
[/s2If]
Join Our Telegram Group
")


