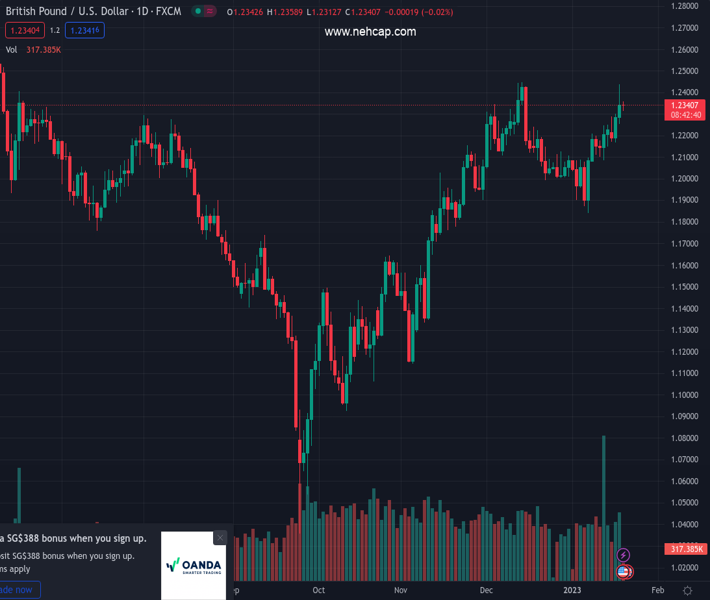
#GBPUSD @ 1.23423 struggles to gain any meaningful traction and oscillates in a range on Thursday. (Pivot Orderbook analysis)
…
This is a premium post.
[s2If !current_user_can(access_s2member_level4)]Please register for PREMIUM VERSION HERE to read full post below containing analysis. In case of any error or you think you are not able to read the full post below, please email us at support#nehcap.com [lwa][/s2If] [s2If current_user_can(access_s2member_level4)]
- GBP/USD struggles to gain any meaningful traction and oscillates in a range on Thursday.
- Recession fears weigh on investors’ sentiment and benefit the greenback, capping gains.
- The prospects for more BoE rate hikes underpin the British Pound and acts as a tailwind.
The pair currently trades last at 1.23423.
The previous day high was 1.2436 while the previous day low was 1.2255. The daily 38.2% Fib levels comes at 1.2367, expected to provide resistance. Similarly, the daily 61.8% fib level is at 1.2324, expected to provide support.
The GBP/USD pair finds some support ahead of the 1.2300 round figure on Thursday and for now, seems to have stalled the previous day’s pullback from its highest level since December 14. The pair, however, struggles to gain any meaningful traction and remains confined in a range below mid-1.2300s through the mid-European session.
A fresh wave of the global risk-aversion trade – amid rising fears of a potential recession – benefits the US Dollar’s relative safe-haven status and caps the upside for the GBP/USD pair. Investors remain concerned about headwinds stemming from the worst COVID-19 outbreak in China and the protracted Russia-Ukraine war. Adding to this, the weaker US macro data released on Wednesday further fuels worries about a deeper global economic downturn and take its toll on the risk sentiment.
The USD bulls, however, remain on the defensive amid firming expectations for a less aggressive policy tightening by the Fed. In fact, the markets now seem convinced that the US central bank will soften its hawkish stance and have been pricing in a smaller 25 bps rate hike in February. This leads to a further decline in the US Treasury bond yields and weighs on the buck. Furthermore, speculations that the Bank of England will stick to a more hawkish stance extends support to the GBP/USD pair.
Investors expect the UK central bank to continue raising interest rates to combat stubbornly high inflation. The bets were lifted by the stronger wage growth data released on Tuesday, which could keep inflation elevated. Furthermore, the headline UK CPI – though fell to a three-month low in December – is still running at levels last seen in the early 1980s. This might continue to act as a tailwind for the British Pound and supports prospects for a further appreciating move for the GBP/USD pair.
Next on tap is the US economic docket, featuring the release of the Philly Fed Manufacturing Index, the usual Weekly Initial Jobless Claims and housing market data. This, along with speeches by influential FOMC members, the US bond yields and the broader risk sentiment, will drive the USD demand and provide some impetus to the GBP/USD pair. Nevertheless, the fundamental backdrop favours bulls, suggesting that any pullback could attract fresh buyers and remain limited.
Technical Levels: Supports and Resistances
GBPUSD currently trading at 1.2349 at the time of writing. Pair opened at 1.2338 and is trading with a change of 0.09 % .
| Overview | Overview.1 | |
|---|---|---|
| 0 | Today last price | 1.2349 |
| 1 | Today Daily Change | 0.0011 |
| 2 | Today Daily Change % | 0.0900 |
| 3 | Today daily open | 1.2338 |
The pair remains strongly bullish on the daily timeframe. It trades above its 20 SMA @ 1.2108, 50 SMA 1.2086, 100 SMA @ 1.1707 and 200 SMA @ 1.1985.
| Trends | Trends.1 | |
|---|---|---|
| 0 | Daily SMA20 | 1.2108 |
| 1 | Daily SMA50 | 1.2086 |
| 2 | Daily SMA100 | 1.1707 |
| 3 | Daily SMA200 | 1.1985 |
The previous day high was 1.2436 while the previous day low was 1.2255. The daily 38.2% Fib levels comes at 1.2367, expected to provide resistance. Similarly, the daily 61.8% fib level is at 1.2324, expected to provide support.
Note the levels of interest below:
- Pivot support is noted at 1.225, 1.2162, 1.2068
- Pivot resistance is noted at 1.2431, 1.2524, 1.2613
| Levels | Levels.1 |
|---|---|
| Previous Daily High | 1.2436 |
| Previous Daily Low | 1.2255 |
| Previous Weekly High | 1.2249 |
| Previous Weekly Low | 1.2086 |
| Previous Monthly High | 1.2447 |
| Previous Monthly Low | 1.1992 |
| Daily Fibonacci 38.2% | 1.2367 |
| Daily Fibonacci 61.8% | 1.2324 |
| Daily Pivot Point S1 | 1.2250 |
| Daily Pivot Point S2 | 1.2162 |
| Daily Pivot Point S3 | 1.2068 |
| Daily Pivot Point R1 | 1.2431 |
| Daily Pivot Point R2 | 1.2524 |
| Daily Pivot Point R3 | 1.2613 |
[/s2If]
Join Our Telegram Group
")


