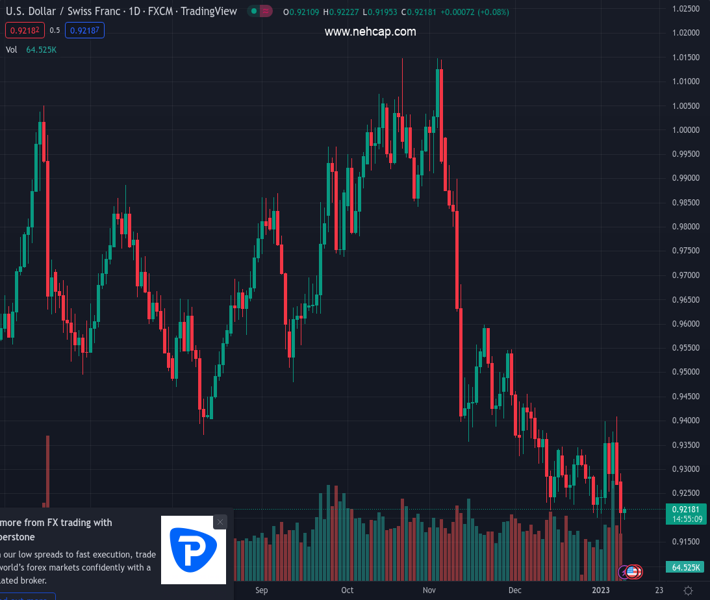
#USDCHF @ 0.92089 picks up bids to pare recent losses around the lowest levels since March 2022., @nehcap view: Further downside expected (Pivot Orderbook analysis)
…
This is a premium post.
[s2If !current_user_can(access_s2member_level4)]Please register for PREMIUM VERSION HERE to read full post below containing analysis. In case of any error or you think you are not able to read the full post below, please email us at support#nehcap.com [lwa][/s2If] [s2If current_user_can(access_s2member_level4)]
- USD/CHF picks up bids to pare recent losses around the lowest levels since March 2022.
- Bearish MACD signals, failure to cross the support-turned-resistance signal further downside.
- 61.8% Fibonacci retracement level guards immediate upside, bears can aim for previous yearly bottom.
The pair currently trades last at 0.92089.
The previous day high was 0.9283 while the previous day low was 0.9167. The daily 38.2% Fib levels comes at 0.9211, expected to provide resistance. Similarly, the daily 61.8% fib level is at 0.9239, expected to provide resistance.
USD/CHF traders lick their wounds around the 10-month low, picking up bids to 0.9210 amid early Tuesday morning in Europe.
In doing so, the Swiss currency (CHF) pair might have taken clues from the downbeat RSI (14) to pare recent losses. However, the bearish MACD signals keep the sellers hopeful.
Additionally favoring the bearish bias could be the quote’s previous failure to jump back beyond the support-turned-resistance line from January 2021, close to 0.9420 by the press time.
It’s worth noting that the 61.8% Fibonacci retracement level of the pair’s upside from January 2021 to October 2022, around 0.9290, restricts immediate recovery moves of the USD/CHF pair ahead of the previous support line near 0.9420.
Also acting as an upside filter is the August 2022 low of 0.9370 and 50% Fibonacci retracement near 0.9450.
Should the USD/CHF bulls keep the reins past 0.9450, the odds of witnessing a reversal to the late 2022 downtrend can’t be ruled out.
Meanwhile, the year 2022 low of 0.9090 appears immediate important support to watch during the USD/CHF pair’s further downside.
Following that, the 78.6% Fibonacci retracement level of 0.9055 could lure the bears ahead of highlighting the 0.9000 psychological magnet.
In a case where the USD/CHF pair remains weak past 0.9000, the mid-2021 low of 0.8926 and the year 2021 bottom surrounding 0.8755 will be in the spotlight.
Trend: Further downside expected
Technical Levels: Supports and Resistances
USDCHF currently trading at 0.9213 at the time of writing. Pair opened at 0.9212 and is trading with a change of 0.01% % .
| Overview | Overview.1 | |
|---|---|---|
| 0 | Today last price | 0.9213 |
| 1 | Today Daily Change | 0.0001 |
| 2 | Today Daily Change % | 0.01% |
| 3 | Today daily open | 0.9212 |
The pair remains strongly bearish on the daily time frame. It trades below the 20 SMA @ 0.929, 50 SMA 0.9458, 100 SMA @ 0.9639 and 200 SMA @ 0.9645.
| Trends | Trends.1 | |
|---|---|---|
| 0 | Daily SMA20 | 0.9290 |
| 1 | Daily SMA50 | 0.9458 |
| 2 | Daily SMA100 | 0.9639 |
| 3 | Daily SMA200 | 0.9645 |
The previous day high was 0.9283 while the previous day low was 0.9167. The daily 38.2% Fib levels comes at 0.9211, expected to provide resistance. Similarly, the daily 61.8% fib level is at 0.9239, expected to provide resistance.
Note the levels of interest below:
- Pivot support is noted at 0.9158, 0.9105, 0.9042
- Pivot resistance is noted at 0.9274, 0.9337, 0.939
| Levels | Levels.1 |
|---|---|
| Previous Daily High | 0.9283 |
| Previous Daily Low | 0.9167 |
| Previous Weekly High | 0.9410 |
| Previous Weekly Low | 0.9223 |
| Previous Monthly High | 0.9471 |
| Previous Monthly Low | 0.9201 |
| Daily Fibonacci 38.2% | 0.9211 |
| Daily Fibonacci 61.8% | 0.9239 |
| Daily Pivot Point S1 | 0.9158 |
| Daily Pivot Point S2 | 0.9105 |
| Daily Pivot Point S3 | 0.9042 |
| Daily Pivot Point R1 | 0.9274 |
| Daily Pivot Point R2 | 0.9337 |
| Daily Pivot Point R3 | 0.9390 |
[/s2If]
Join Our Telegram Group
")


